Web Dashboard Guide
The web dashboard is where you triage findings, browse hosts, run modules, chat with the AI advisor, and build reports for one engagement at a time.
Opening the Dashboard
The dashboard is served by the Raven server. Once the server is running, either in Docker or as a bare binary (see Install & Pair), browse to it:
- Docker:
http://localhost:8080 - Bare binary:
http://localhost:8080by default, or the-pport you started it with
The single-user server binds 127.0.0.1 by default; reach it from another machine over an SSH tunnel rather than exposing it (see Troubleshooting).
Dashboard Home
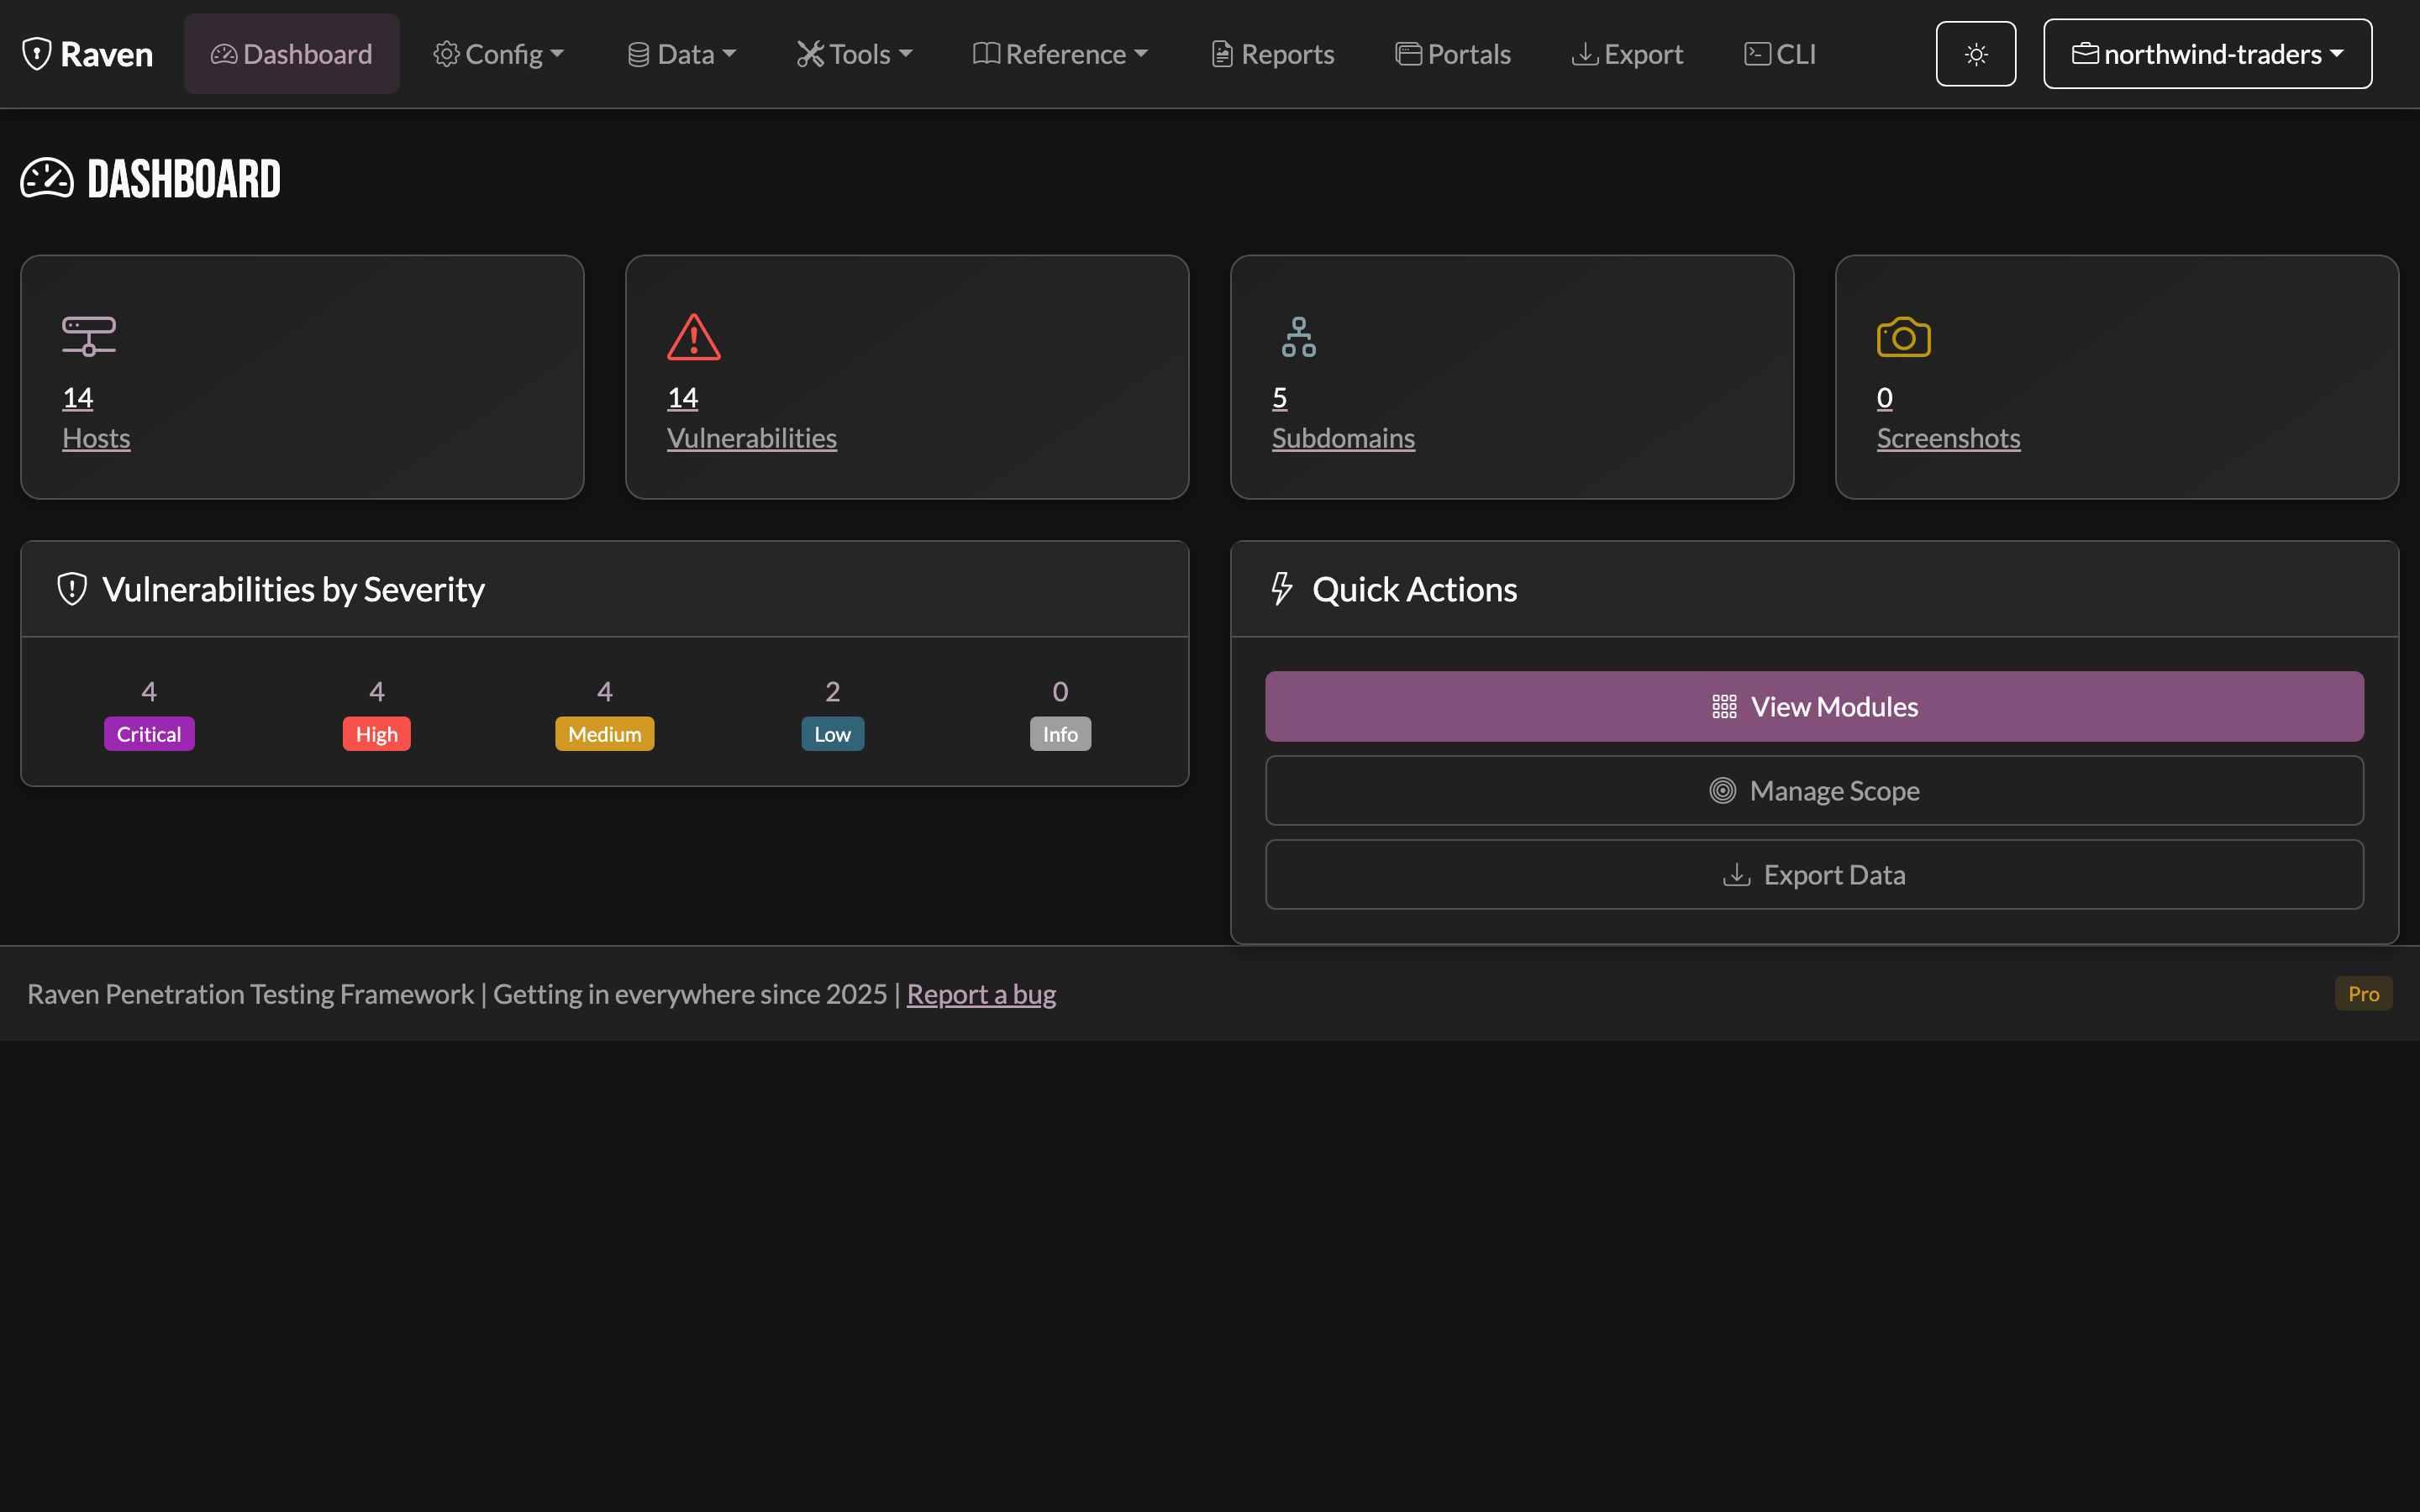
The main dashboard provides an at-a-glance view of your engagement:
- Engagement Summary - Name, type, and status
- Finding Statistics - Breakdown by severity with visual chart
- Recent Activity - Latest findings and updates
- Quick Actions - shortcuts to import a scan, run a module, or start a report
Severity Distribution
The dashboard prominently displays your finding distribution: - Critical (Red) - Immediate attention required - High (Orange) - Significant risk - Medium (Yellow) - Moderate risk - Low (Blue) - Minor issues - Info (Gray) - Informational findings
Findings Management
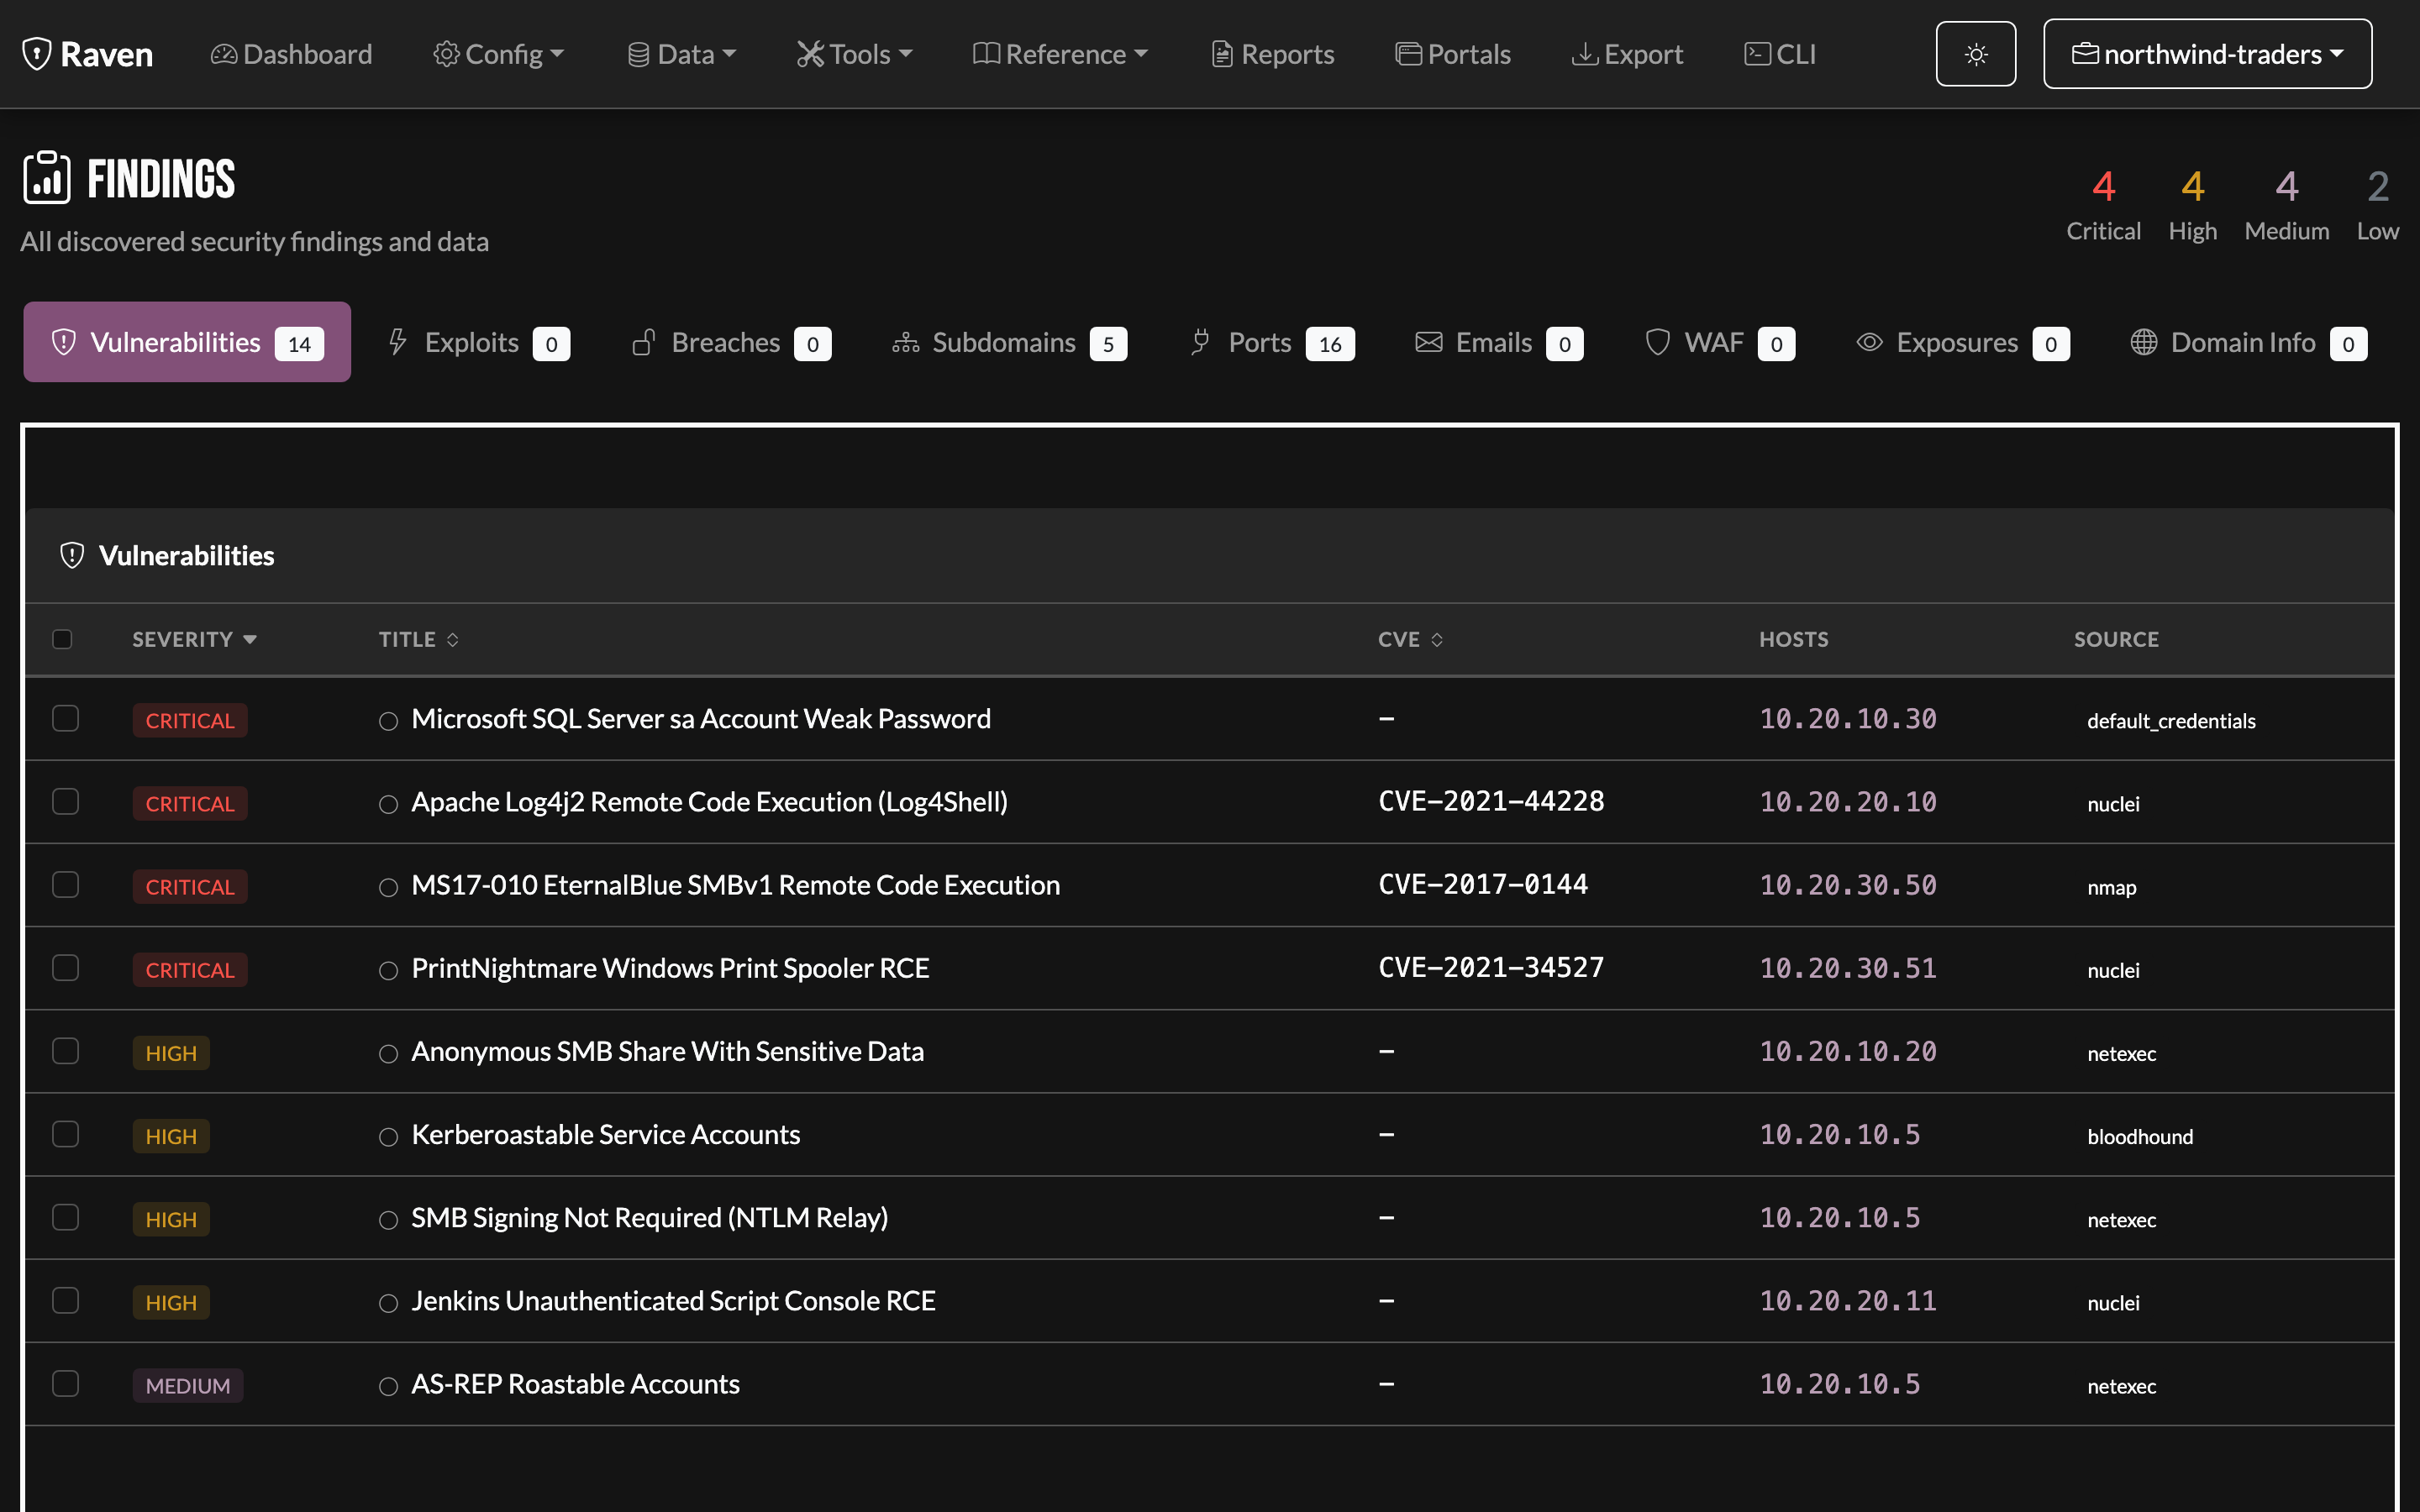
The findings view is where you triage what the scans turned up:
Features
- Severity badges - Color-coded for quick identification
- Filtering - By severity, status, target, or search term
- Sorting - By any column
- Bulk actions - Update multiple findings at once
- Add Finding - Record something you found by hand
- Export - CSV, JSON, or direct to report
Adding a finding manually
Not everything comes from a scanner. Add Finding, on the Findings page, records anything you found by hand: title, host, severity, category and description.
The host field is free text rather than a picker, because a manually-raised
finding often names something no scan discovered. Leave it blank and the
finding is stored against N/A.
Findings entered this way are ordinary findings. They appear in the same tables, count toward the severity totals, and go into reports and exports alongside scanner output, so Raven can be your reporting tool without a round trip through PlexTrac.
Finding Details
Click any finding to see: - Full description and evidence - Affected targets - CVSS score and vectors - Remediation guidance - CVE references - Status history
Status Workflow
- Open - Newly discovered
- Confirmed - Manually verified
- False Positive - Not actually vulnerable
- Remediated - Fixed by client
- Accepted - Risk accepted
Vulnerabilities View
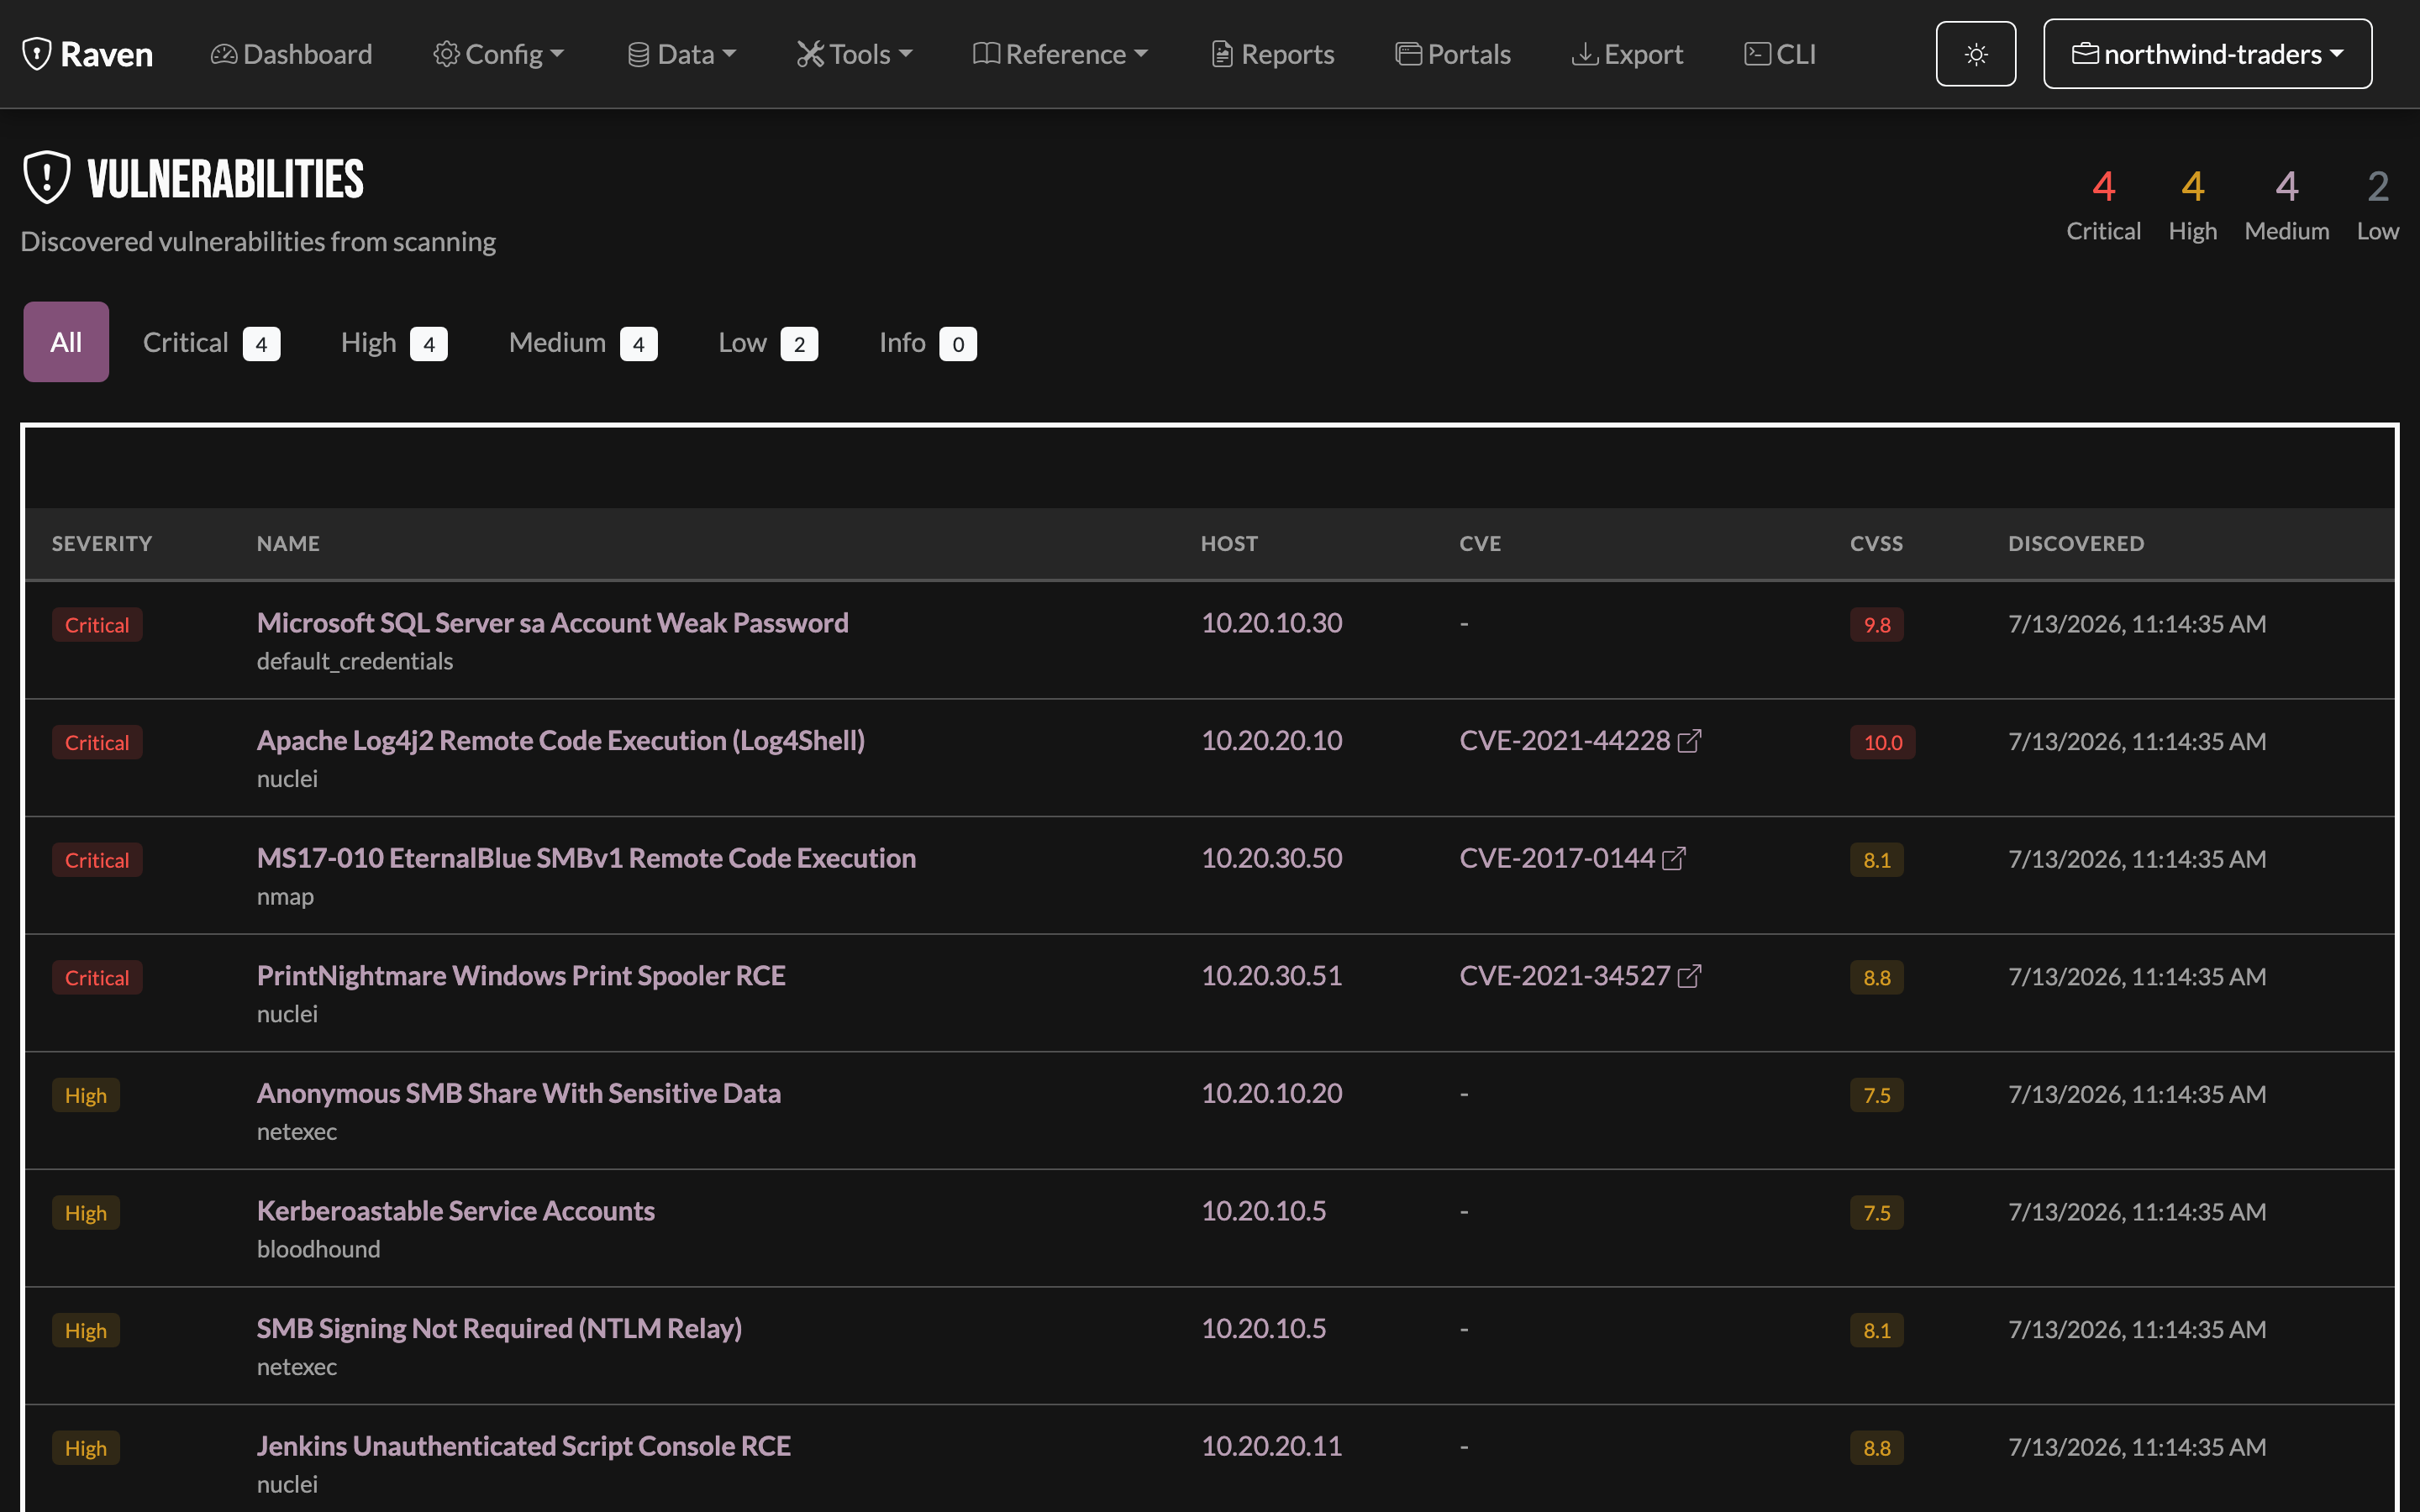
The Vulnerabilities view groups discovered issues by severity with at-a-glance counts (Critical / High / Medium / Low / Info), the affected host, CVE, CVSS score, and the source tool (nuclei, nessus, manual, etc.). Filter the tabs to focus on a severity band.
Hosts & Targets
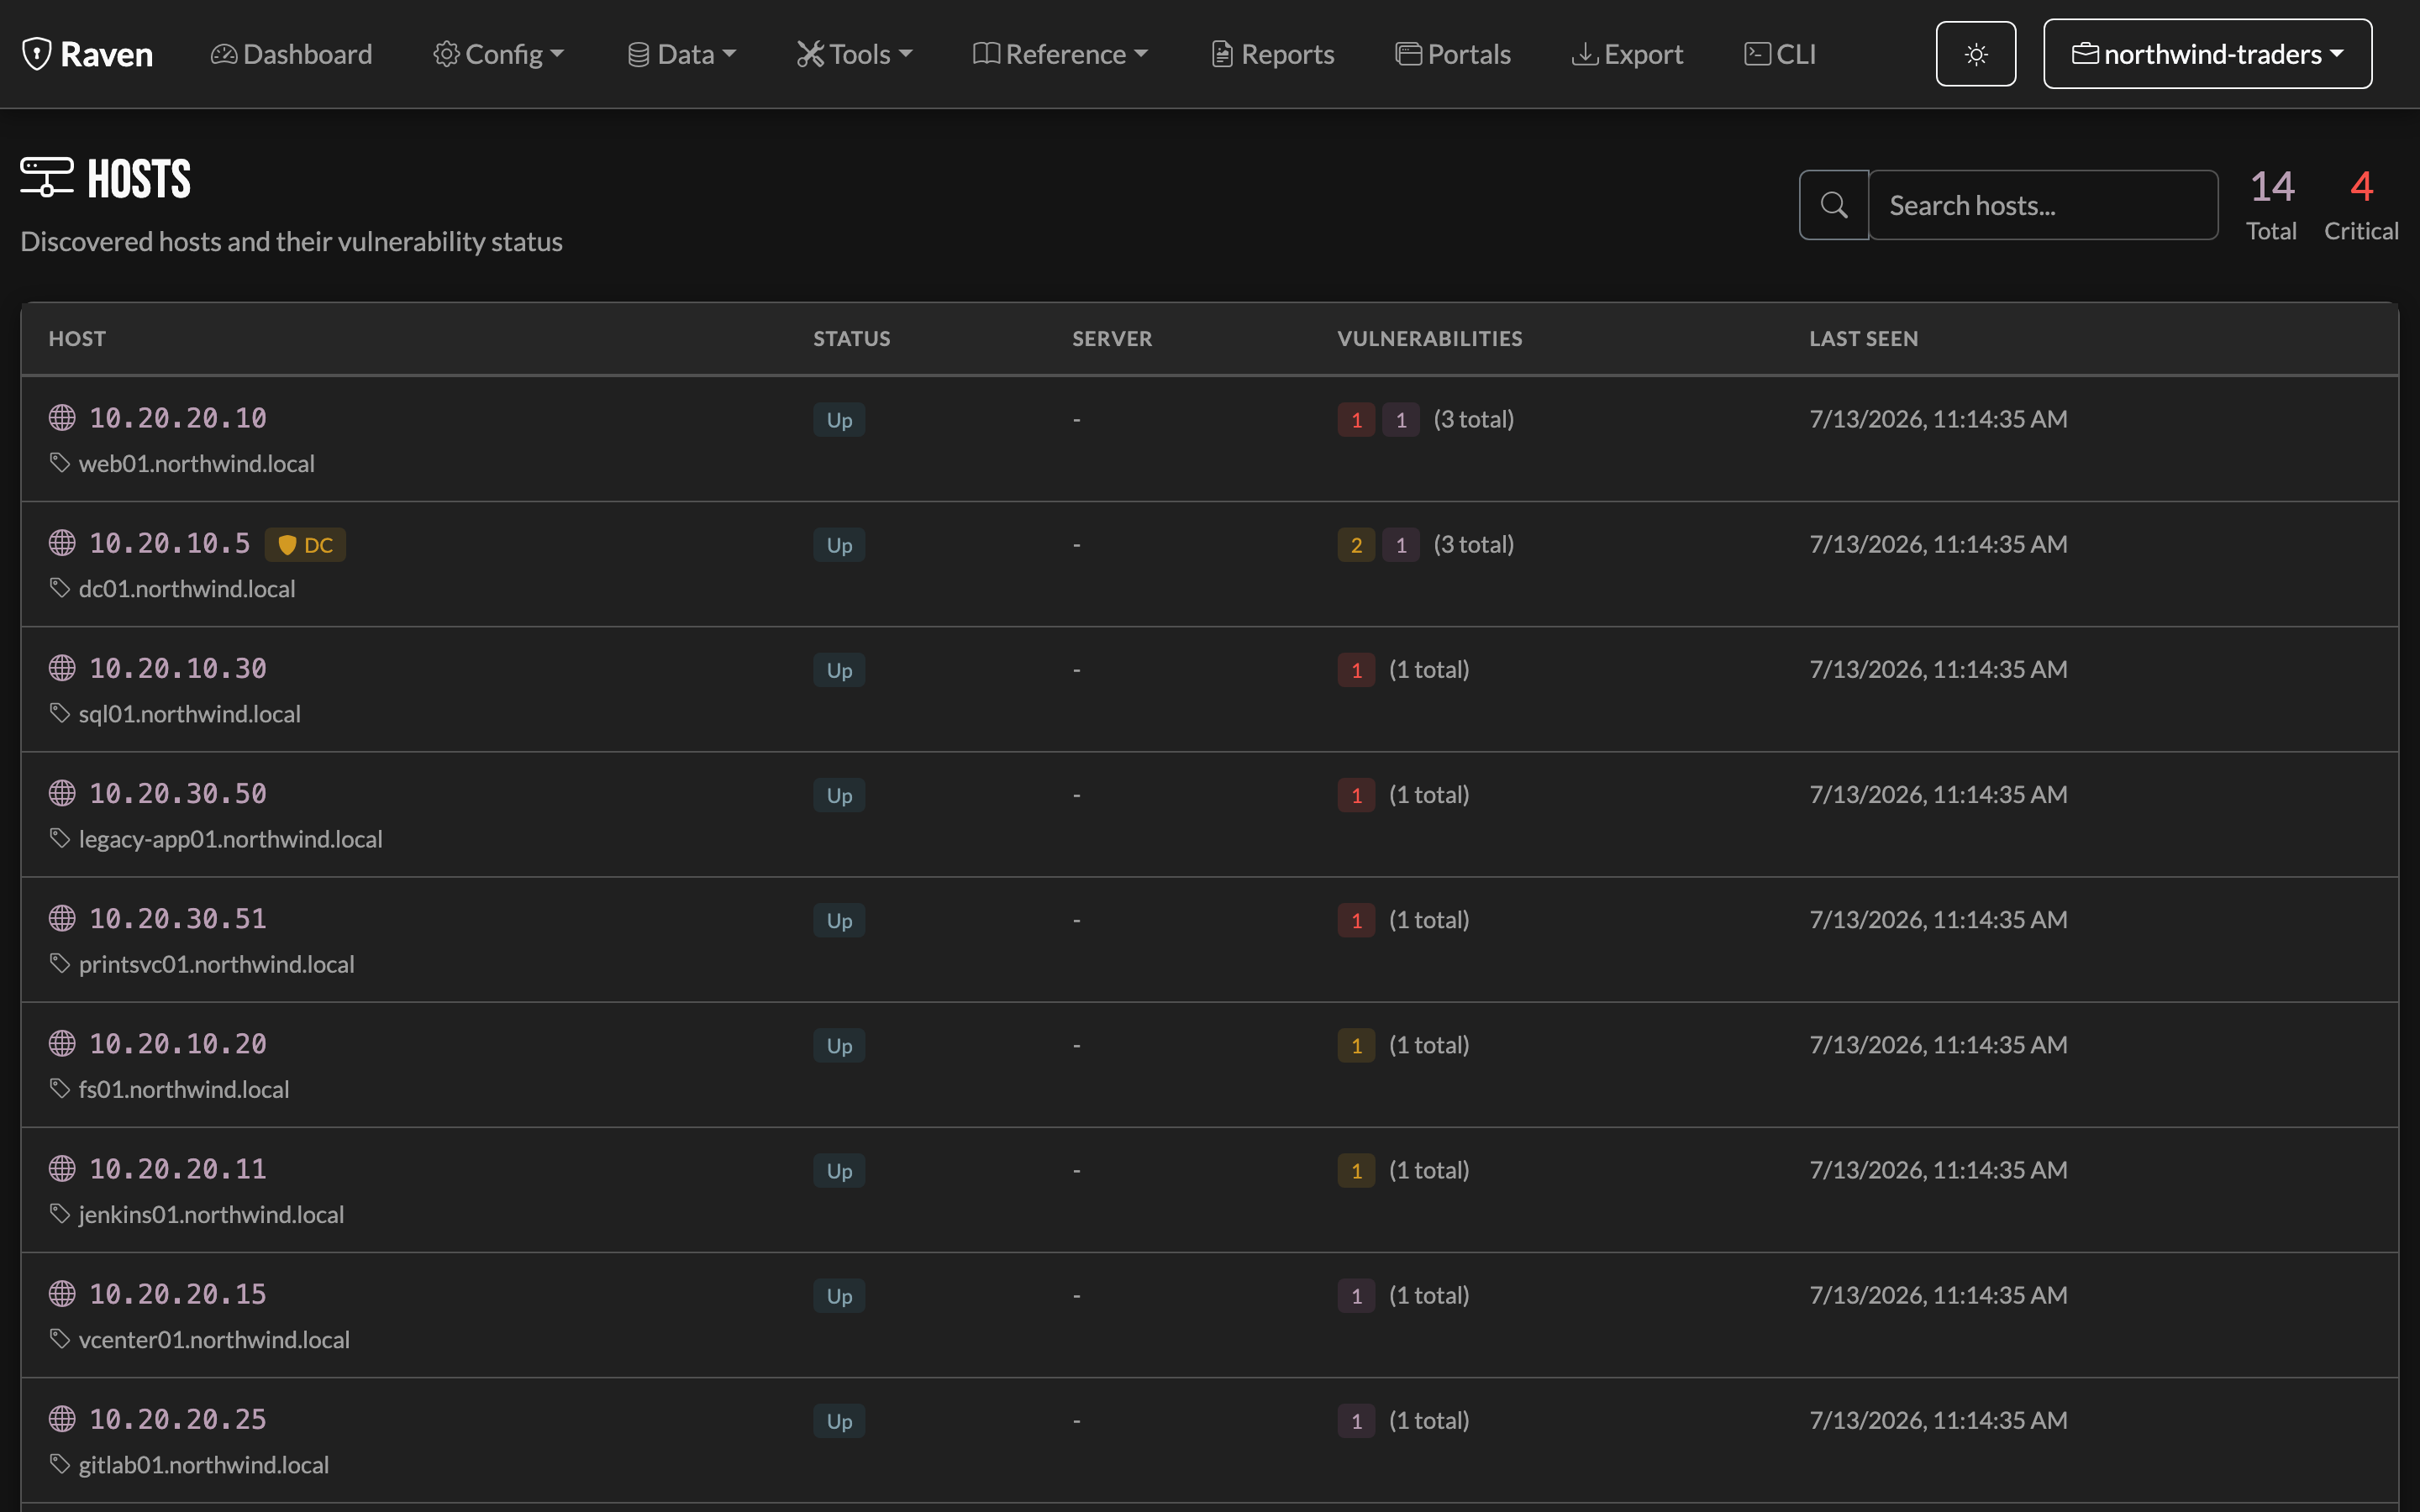
Track all discovered systems:
- Host inventory - All IPs, hostnames, URLs
- Status indicators - Responding, filtered, down
- Server fingerprints - Technologies detected
- Vulnerability counts - Per-host finding summary
- Last seen - Activity tracking
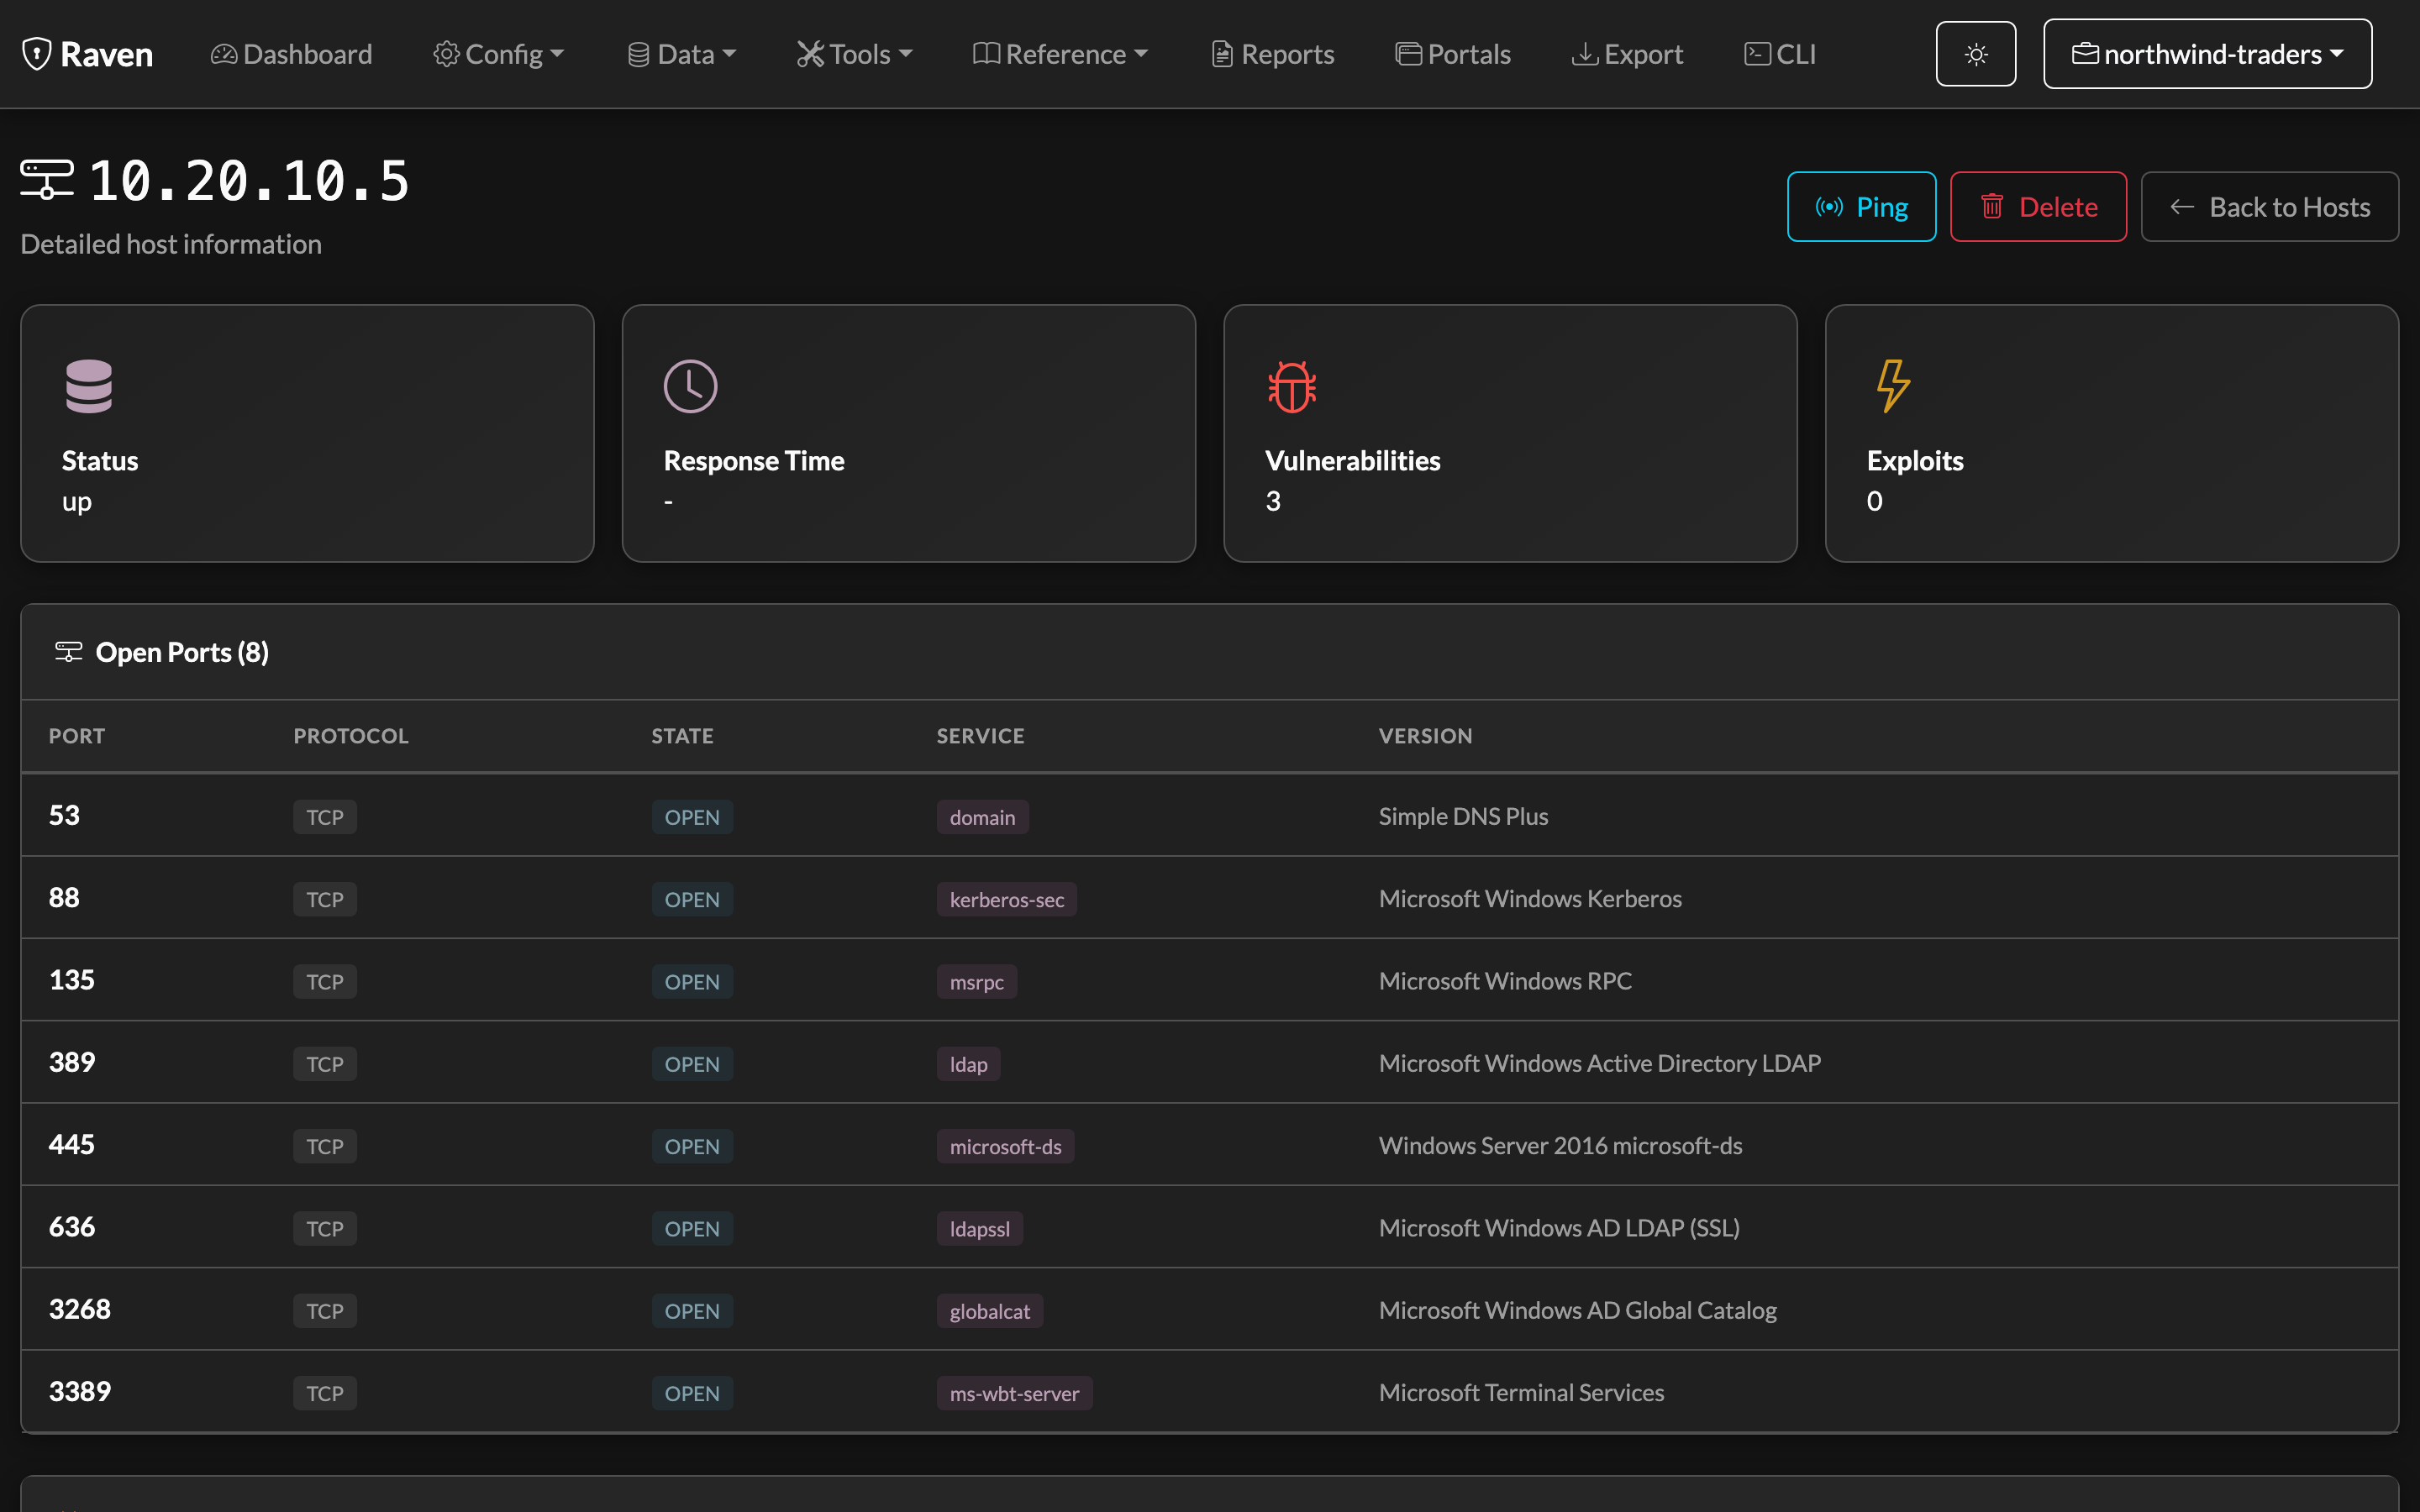
Click any host to open its detail page, which shows the fingerprint, open ports and services, and the vulnerabilities tied to that host:
Scope Management
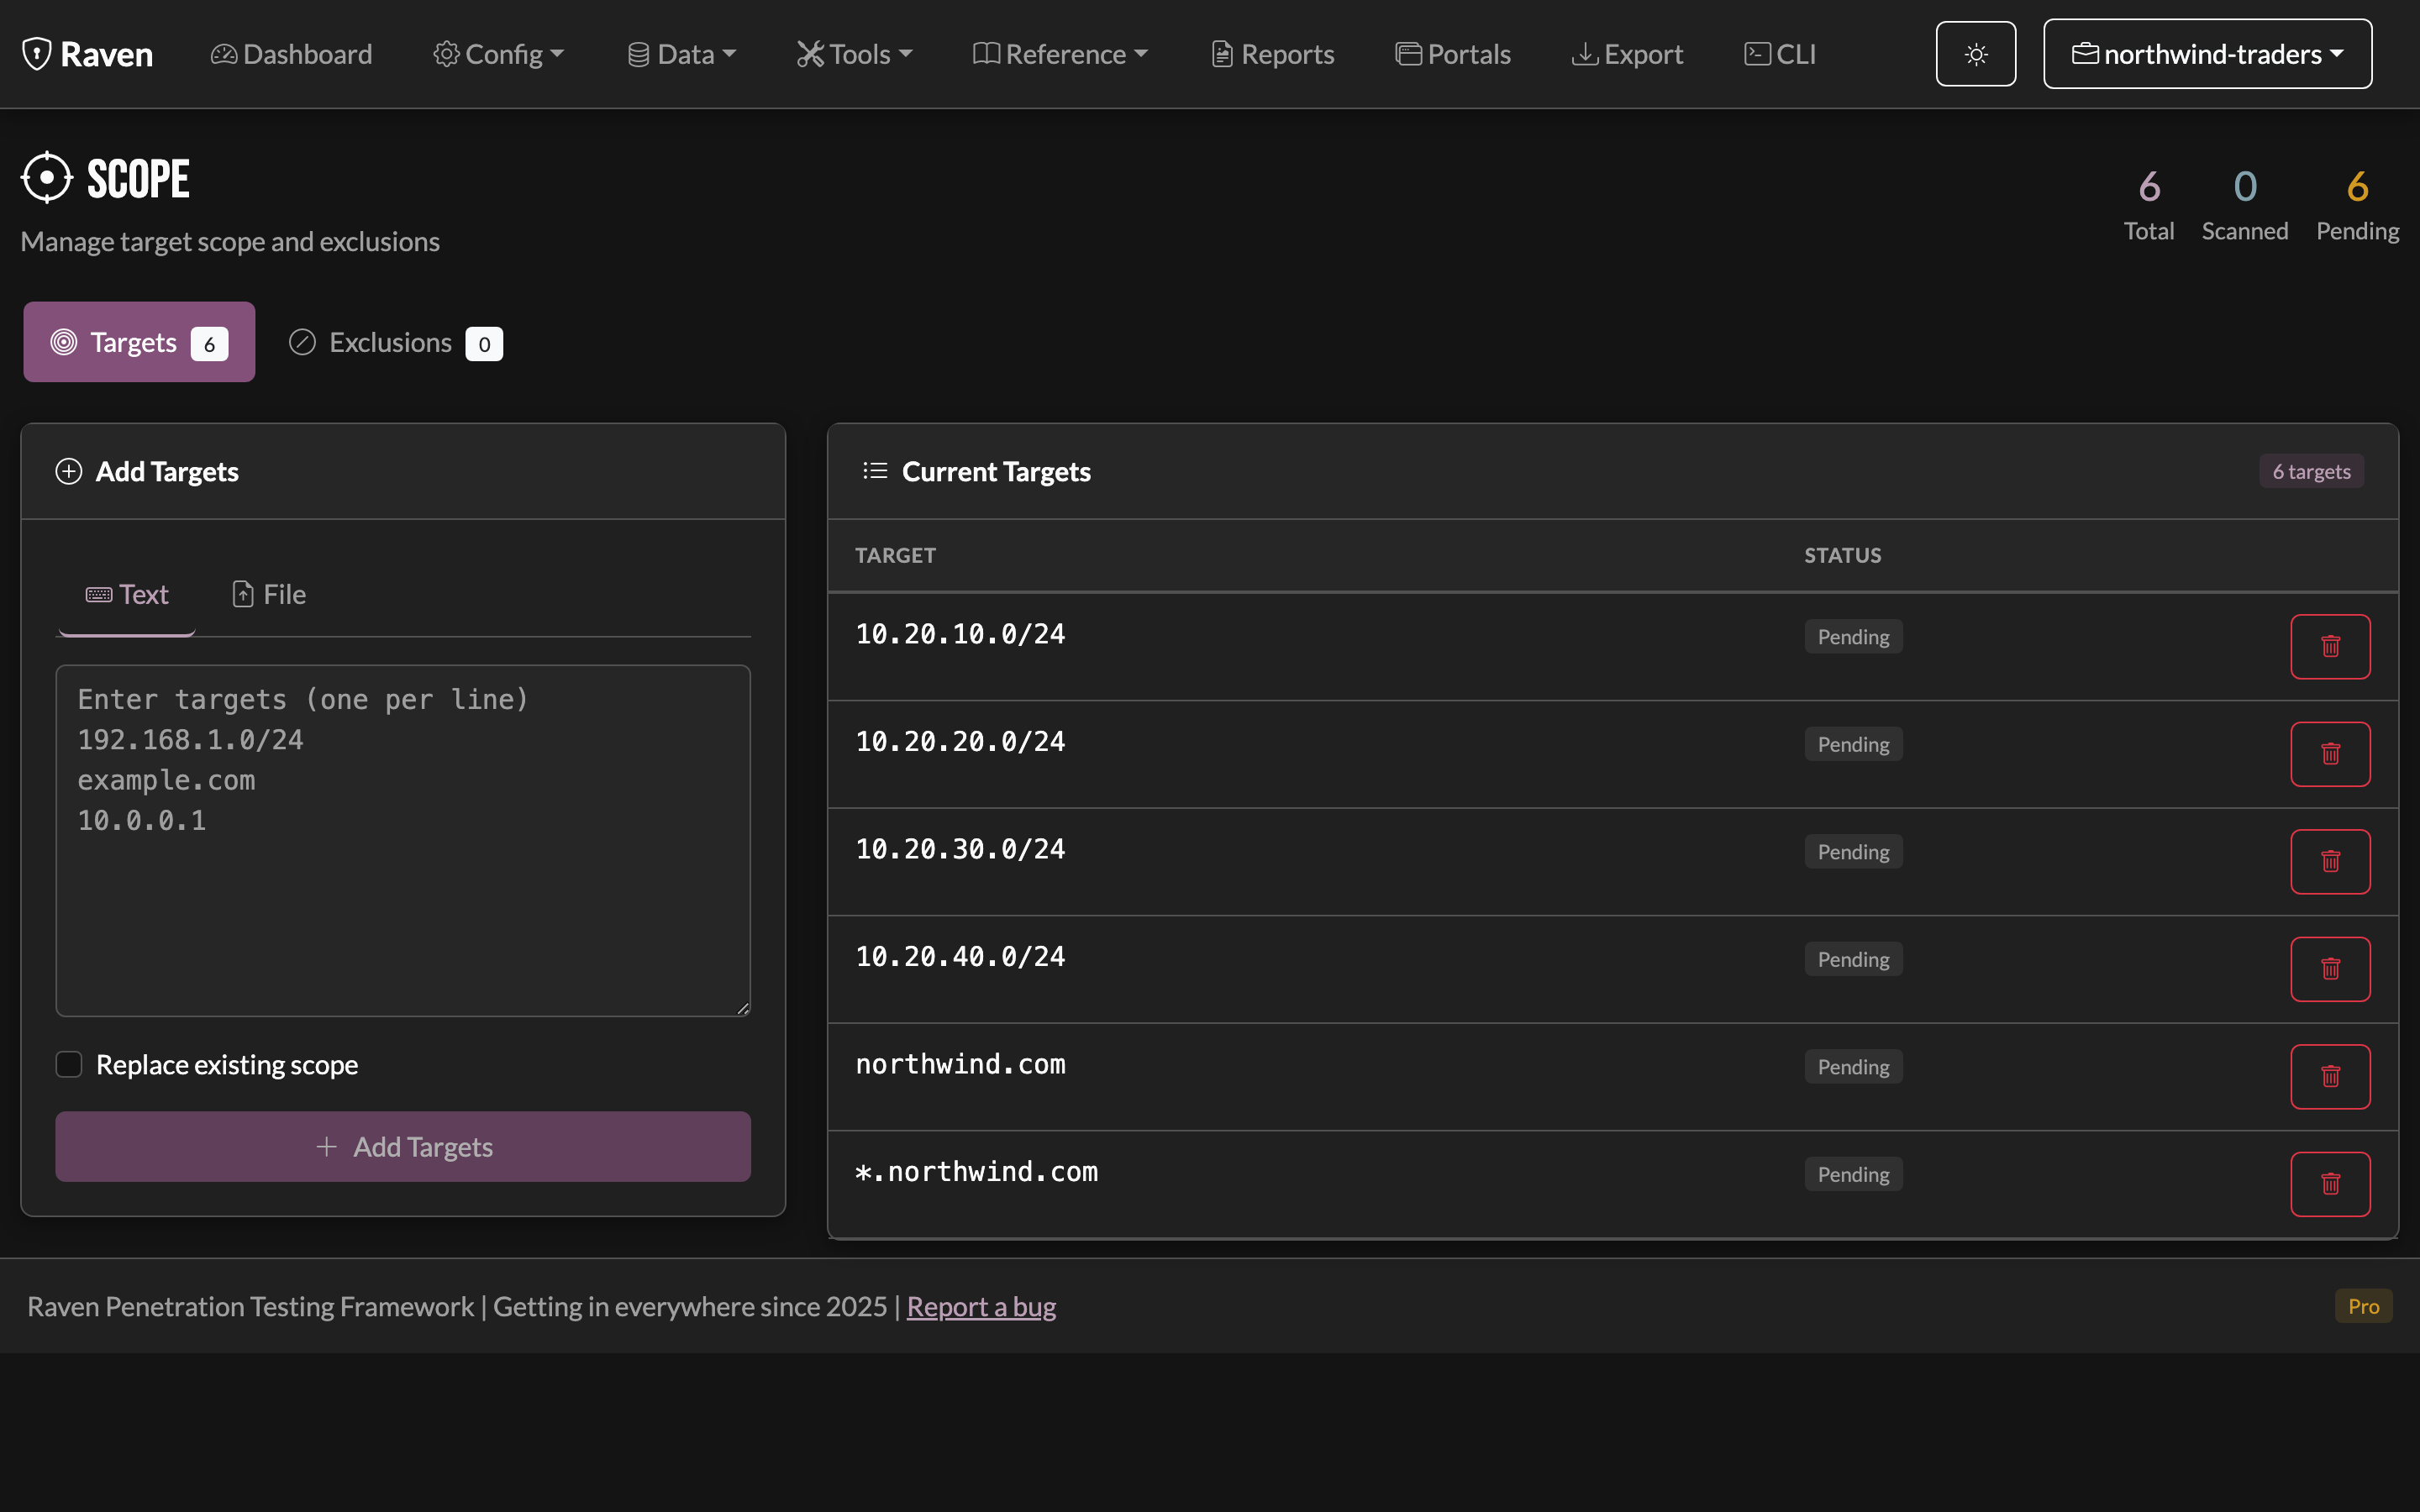
Define and manage your assessment boundaries:
- In-scope targets - What you're authorized to test
- Exclusions - Systems to avoid
- Import/Export - Bulk scope management
- Validation - Ensure targets match scope
Reports & Documentation
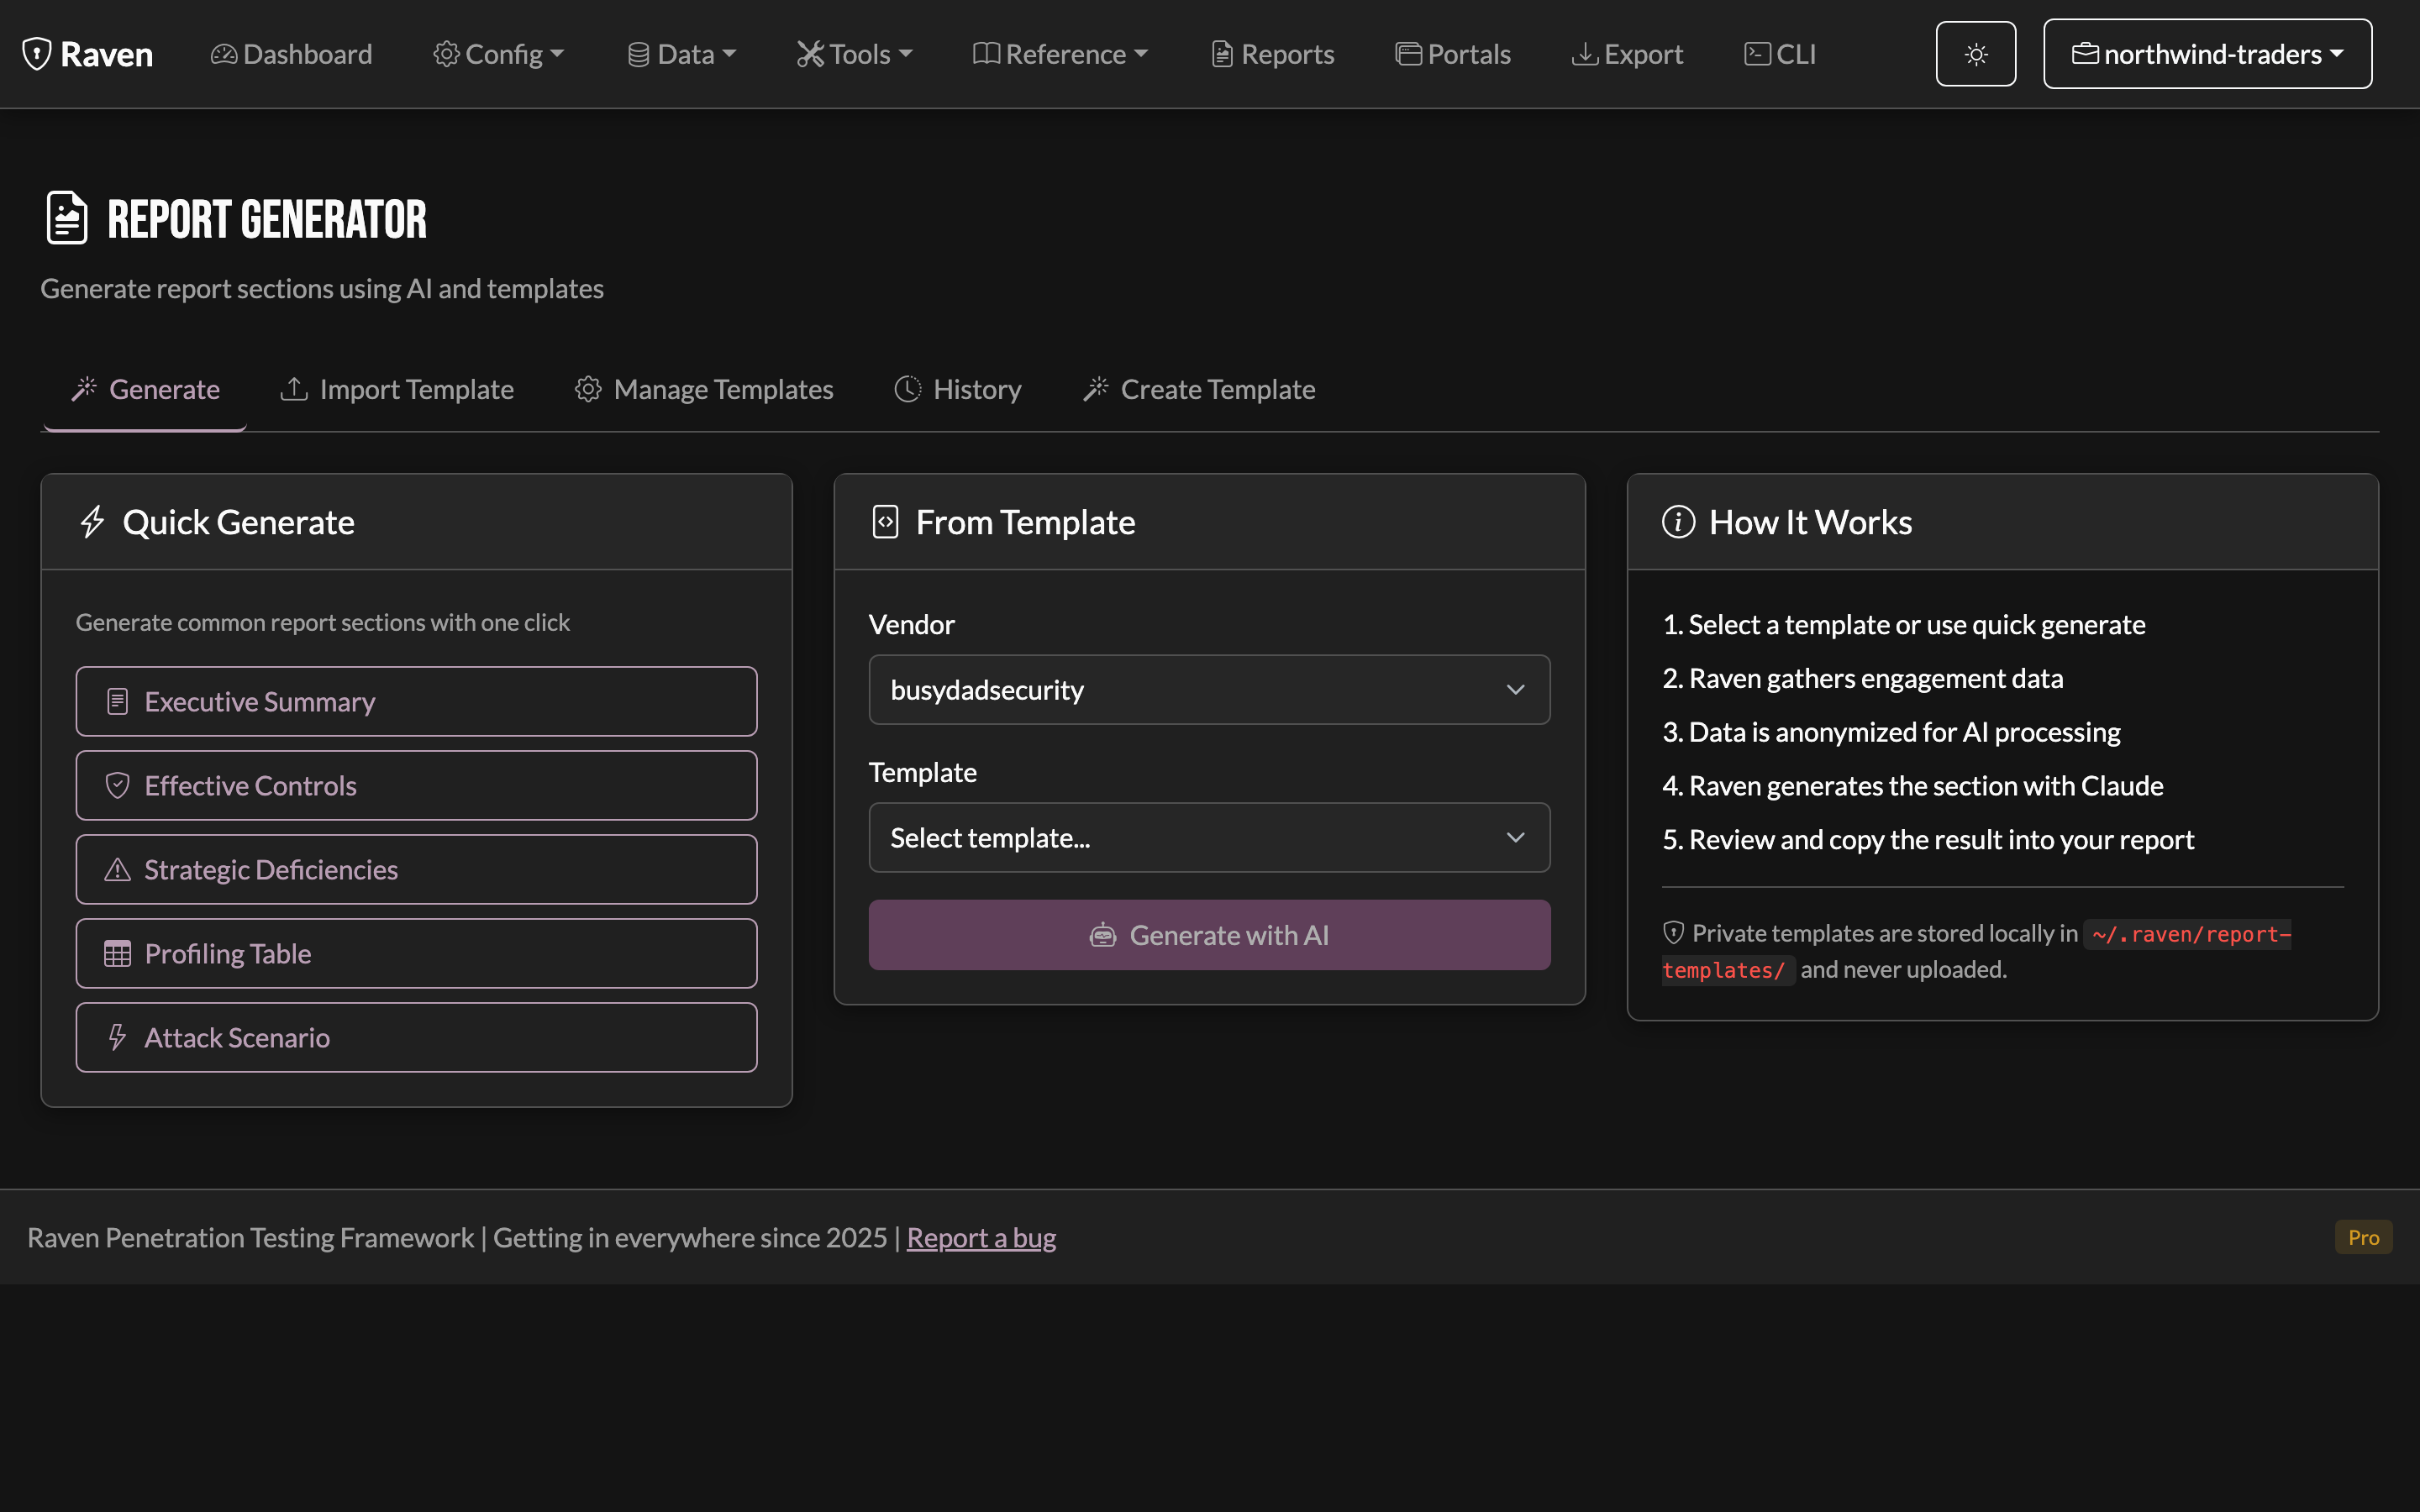
There are two ways to get a report out of Raven: the basic report, which is built from your engagement data alone, and the AI narrative reports, which draft prose you then edit. The basic report needs no AI and no credits.
Basic report (no AI)
Every tier, no credits
The Basic Report tab is the first tab on the Reports page and works on every install, paired or not. It never calls out to Chamber Door, so it also works air-gapped. See Offline Mode.
A deliverable built entirely from what's already in the engagement:
- Scope: your in-scope entries and exclusions exactly as you wrote them (a
/24stays a/24) - Methodology: checklist progress per phase, the tooling that actually ran with run counts and timestamps, and any items you skipped along with the reason
- Host inventory: hosts with open ports, detected server, and per-host finding counts
- Findings: de-duplicated across hosts and grouped by severity, with description, recommendation, CVE/CWE and CVSS where known
Read it in the browser, or download it as a PDF with Download PDF. The same report is available from the terminal:
raven-server reports basic                        # markdown, into <engagement>/reports/
raven-server reports basic --format pdf           # PDF
raven-server reports basic -f pdf -o ./acme.pdf   # PDF, to a path you choose
Because it reads only local data, the same engagement always produces the same report. That's useful when you need to regenerate a deliverable months later.
AI narrative reports
These draft the prose a client report needs and draw from your AI credit balance. Use them on top of the basic report, not instead of it.
Report Templates
- Executive Summary - High-level for management
- Technical Report - Detailed findings for IT teams
- Full Report - Comprehensive documentation
- Custom Templates - Create your own formats
Report Features
- AI-assisted narratives - draft finding write-ups and executive summaries you then edit
- Finding inclusion - Select which vulnerabilities to include
- Severity filtering - Focus on what matters
- Multiple formats - PDF, DOCX, Markdown, HTML
- Template library - Save and reuse templates
PlexTrac Integration
Export directly to PlexTrac for: - Writeup import - Finding sync - Narrative generation
AI Analysis
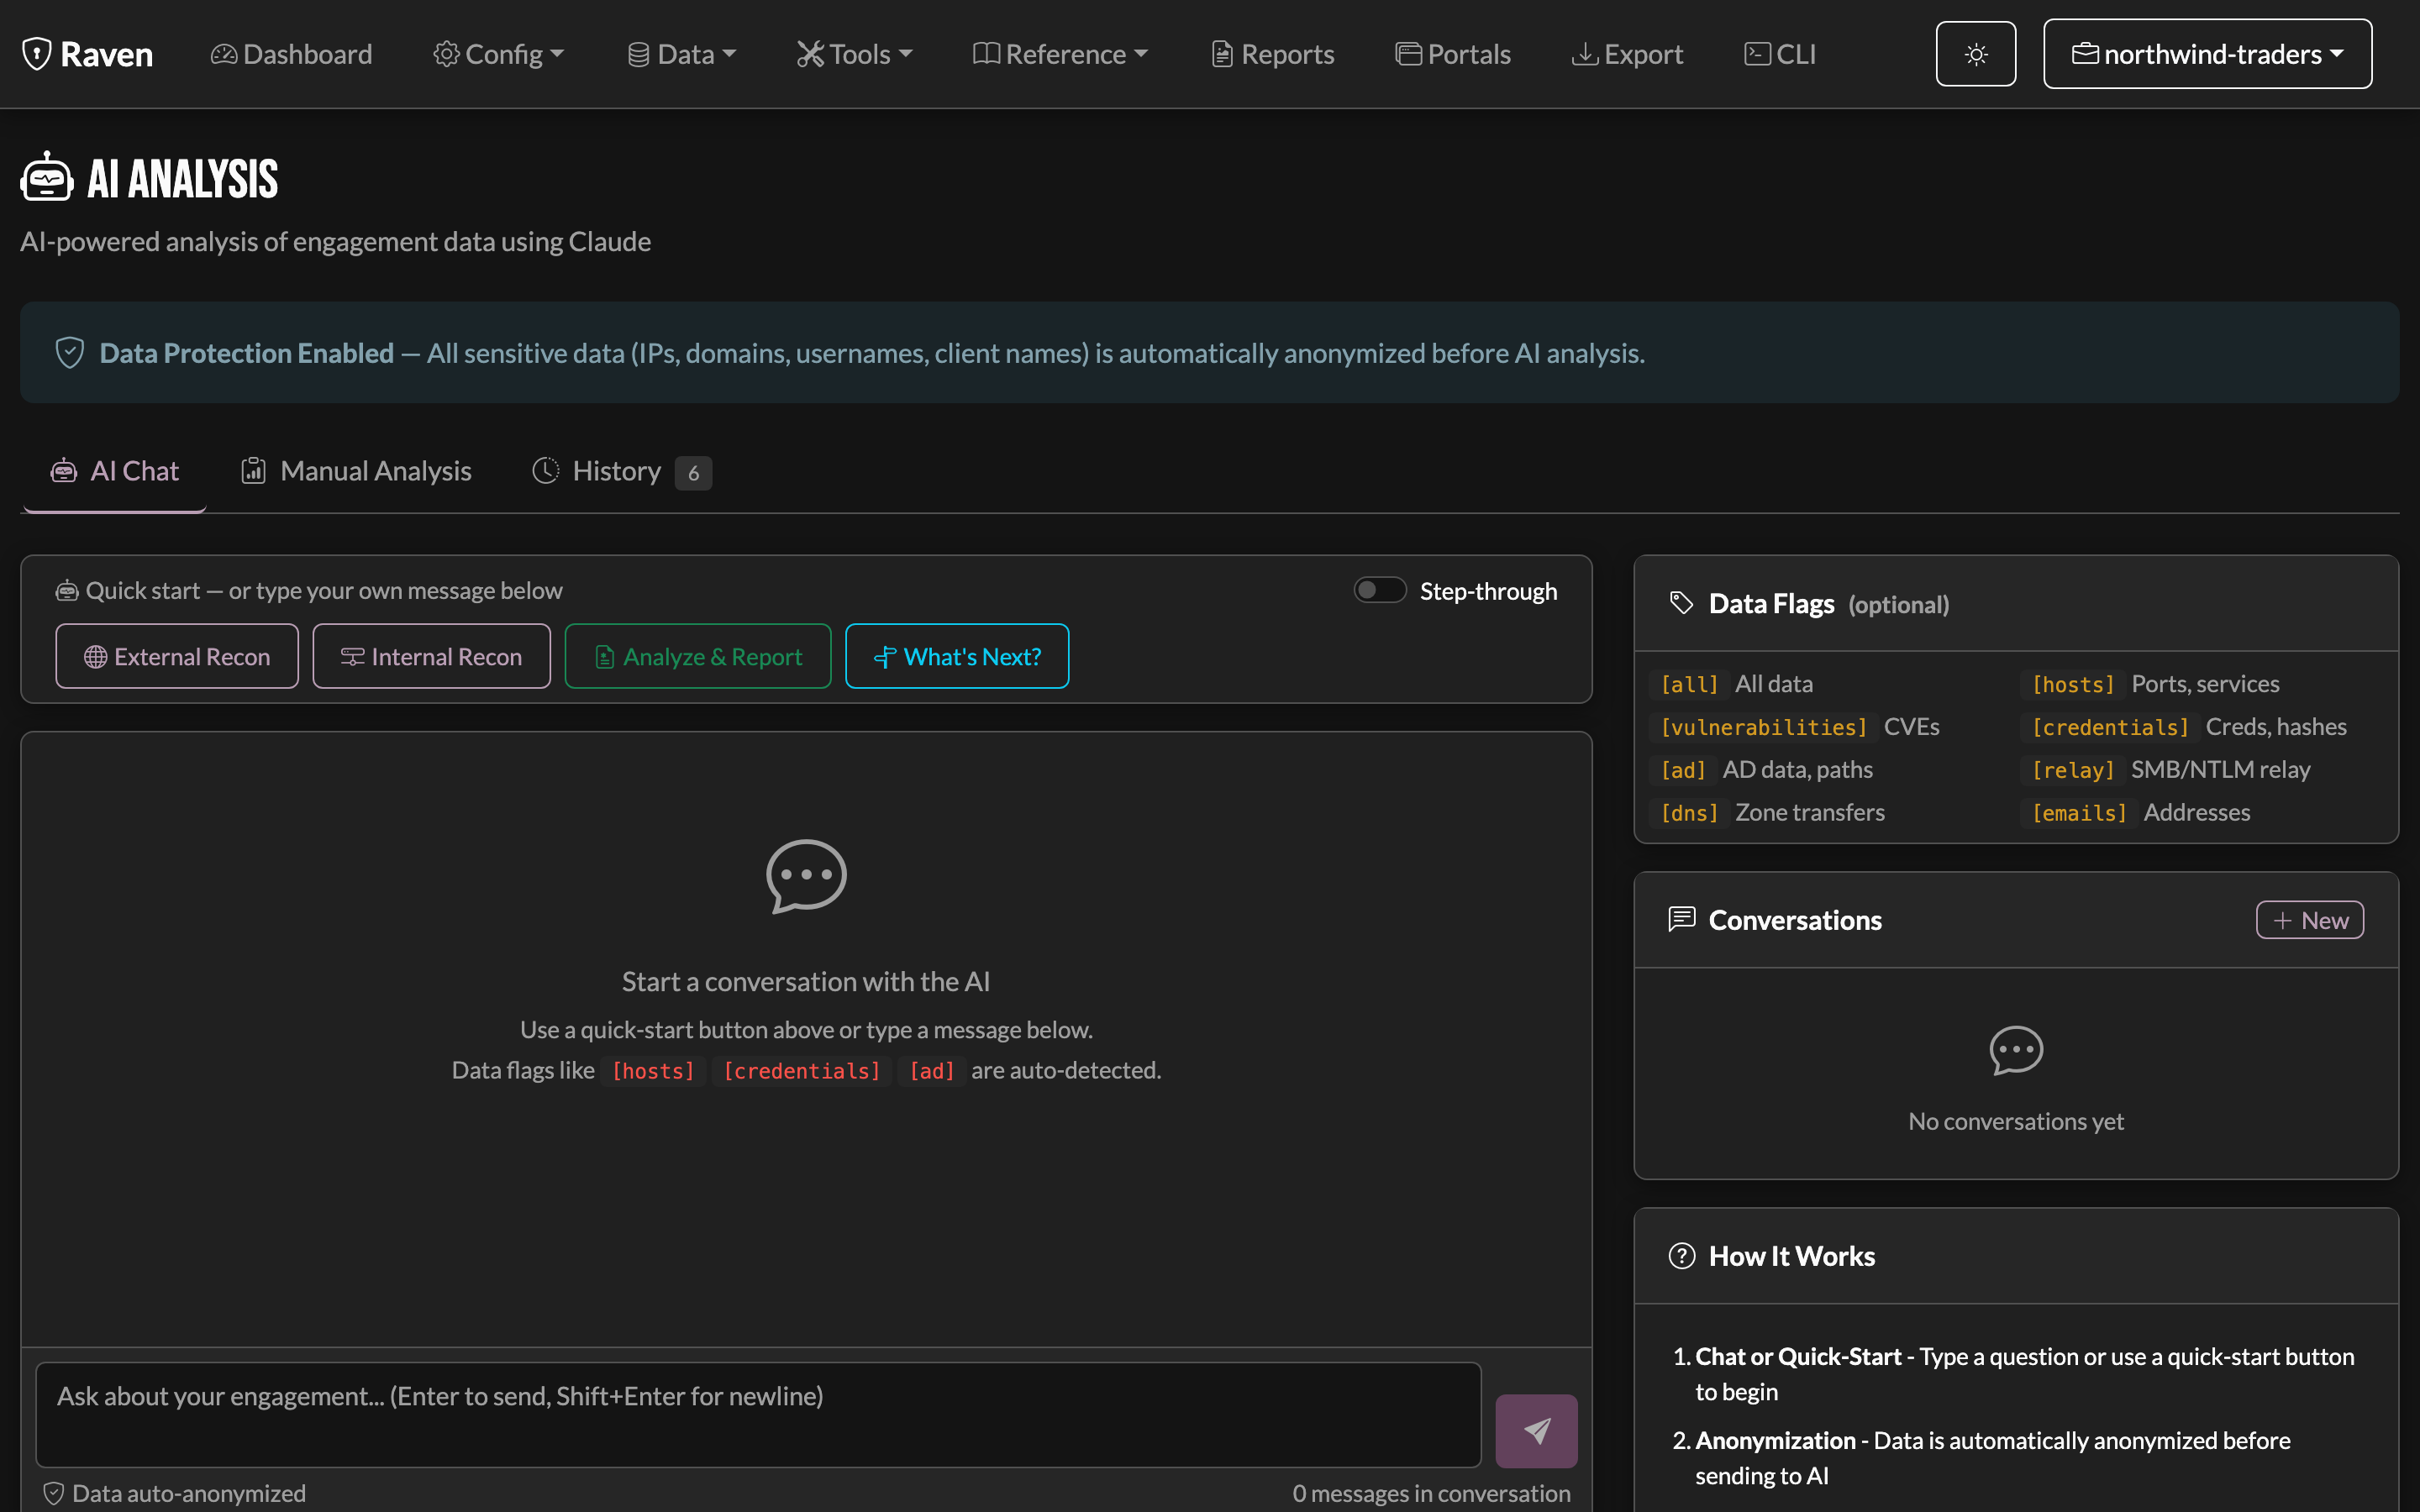
The AI Analysis section is a chat interface backed by your open engagement. Ask the advisor what to do next, have it run modules and reason over the results, and draft findings and report narratives. Engagement data is anonymized on your machine before anything is sent. AI needs a paired device with available AI credits and routes through Chamber Door. Everything else on this page works without it. See the AI Analysis guide.
Modules & Scanning
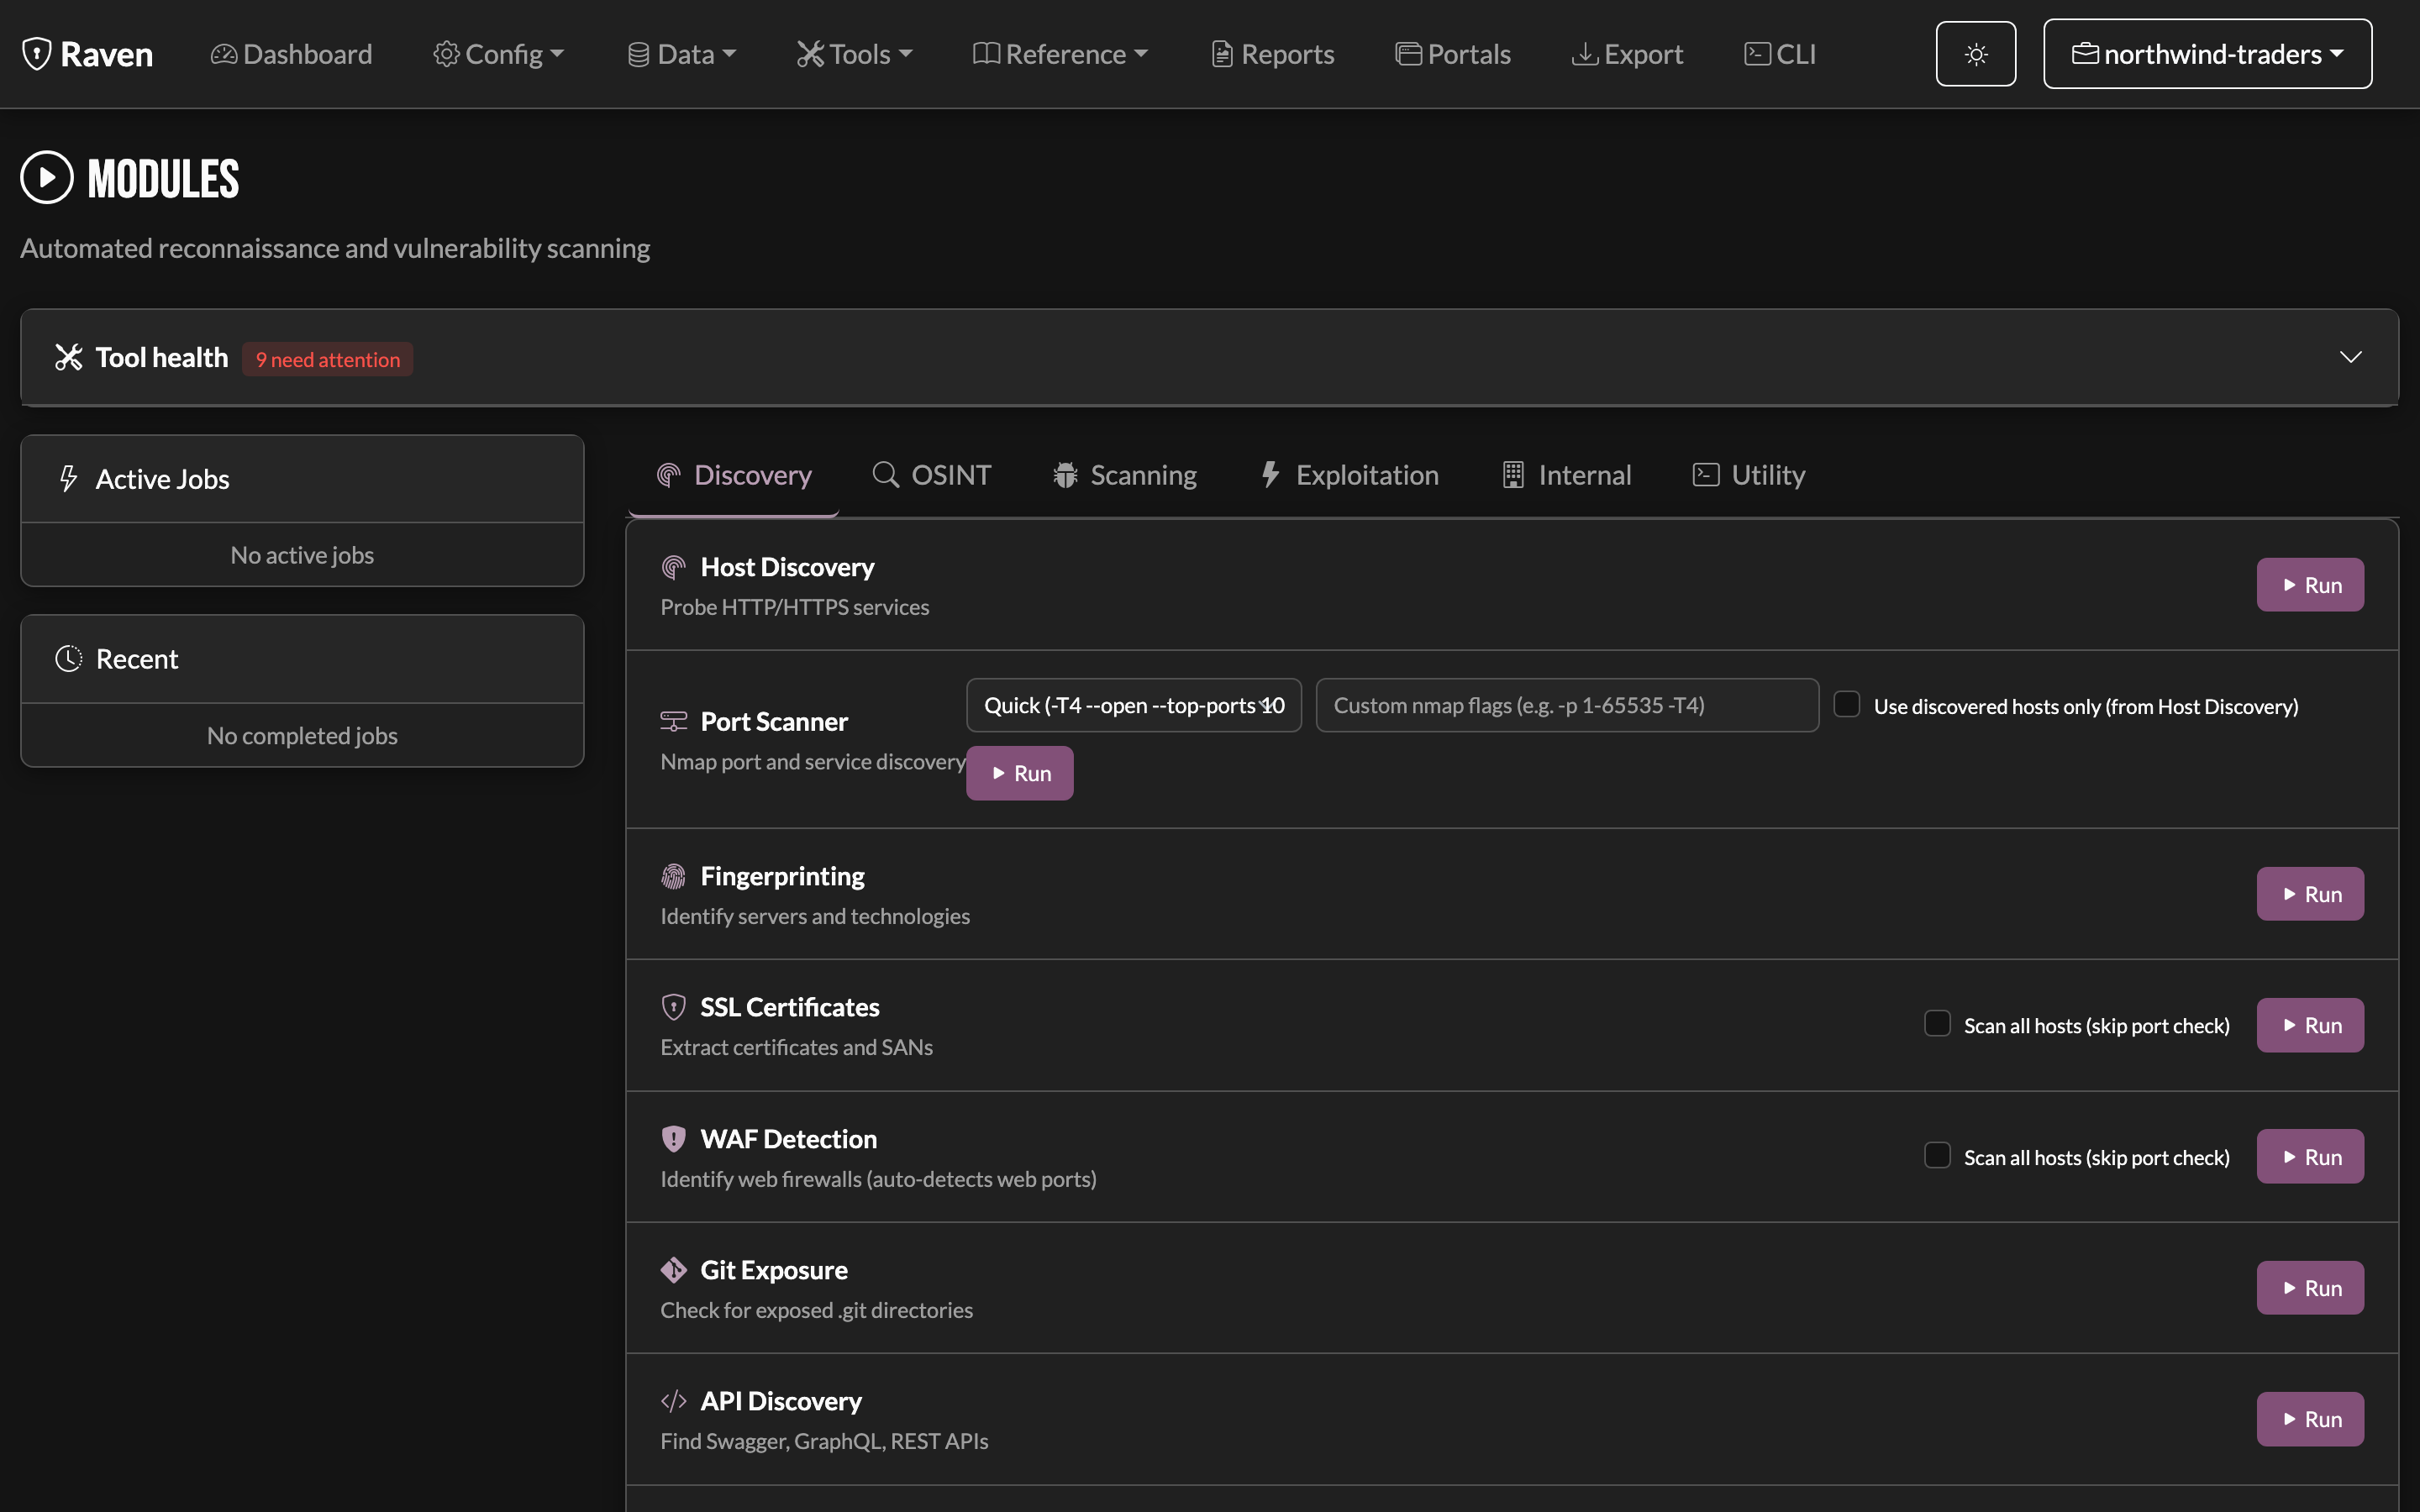
Run security checks directly from the UI:
Available Modules
- Nuclei Scanner - Template-based vulnerability scanning
- DNS Zone Transfer - Test for misconfigurations
- Email Security - SMTP checks including open-relay detection
- FTP Security - Anonymous access, permissions
- Default Credentials - Common password testing
- SSL/TLS Analysis - Certificate and cipher checks
Open-relay testing also has a dedicated raven-server smtp-relay command.
Module Features
- One-click execution - No command line needed
- Progress tracking - Real-time status updates
- Results integration - Findings auto-imported
Workflows
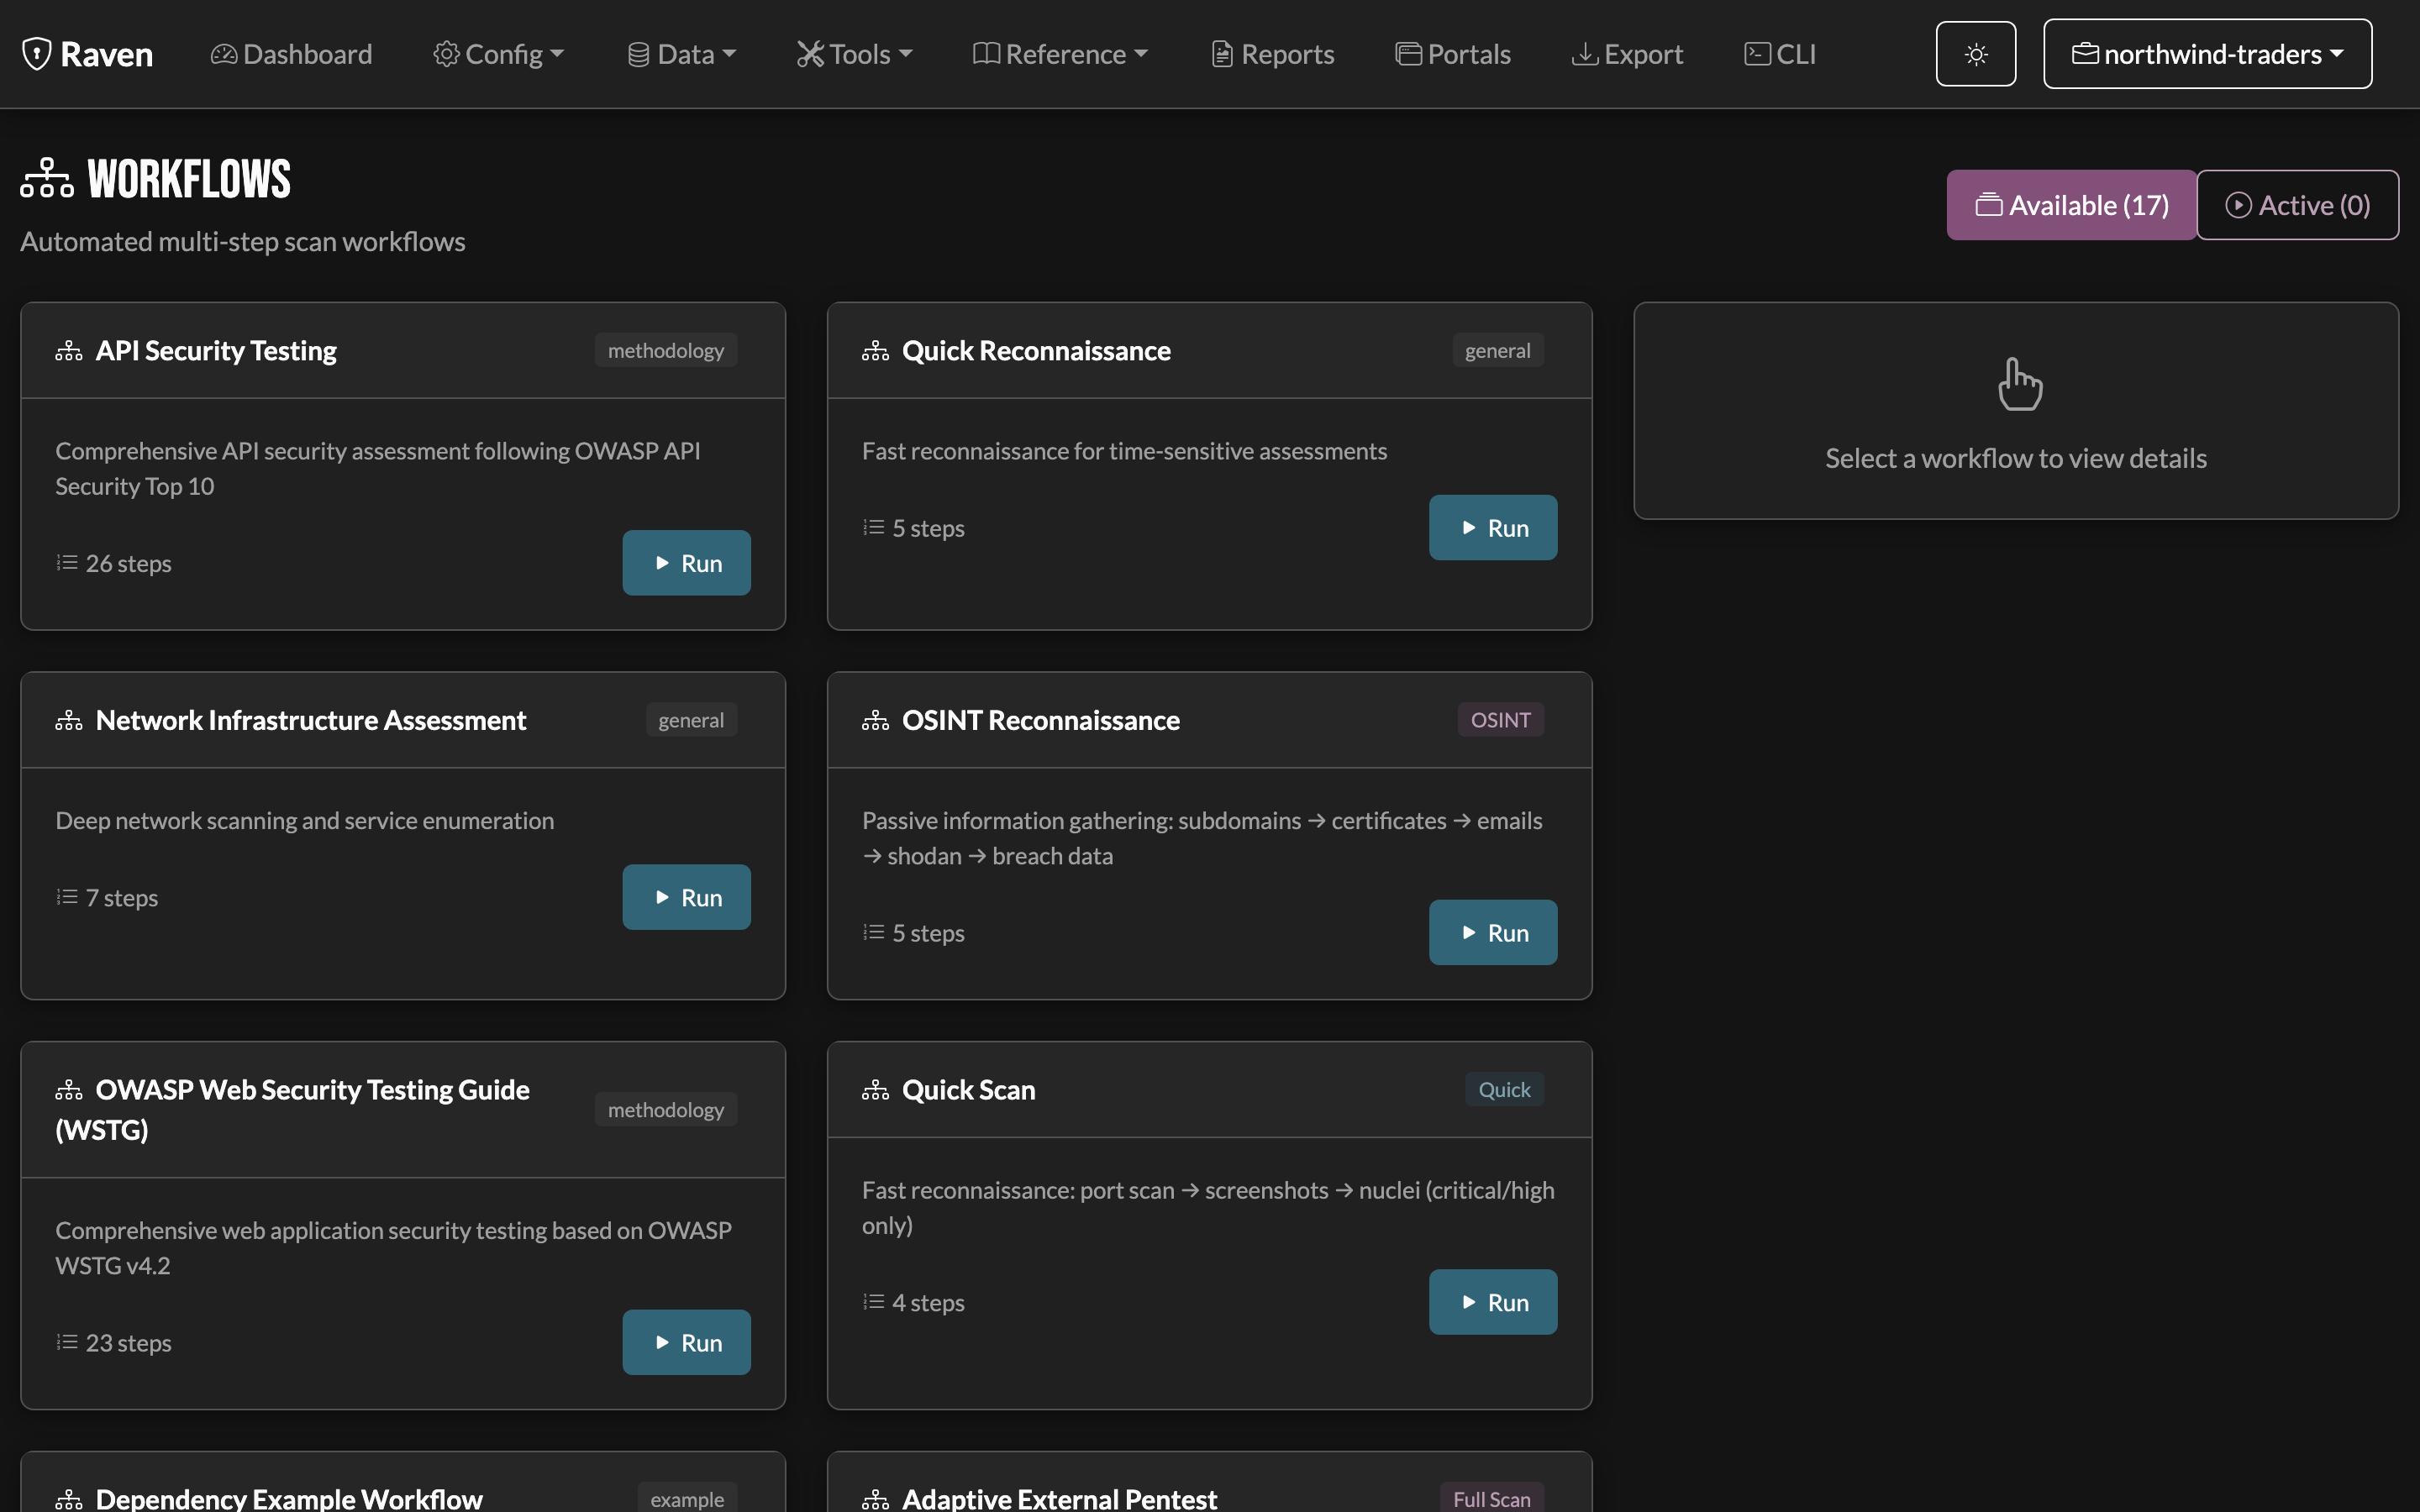
Automate common assessment tasks:
Predefined Workflows
- Web Application Assessment - Full web app testing
- Network Discovery - Host and service enumeration
- Vulnerability Scan - Comprehensive vuln detection
- Credential Testing - Default password checks
Workflow Features
- Step-by-step progress - Visual execution tracking
- Pause/Resume - Control your scans
- Parallel execution - Multiple targets simultaneously
- Auto-findings - Results automatically captured
Export & Integration
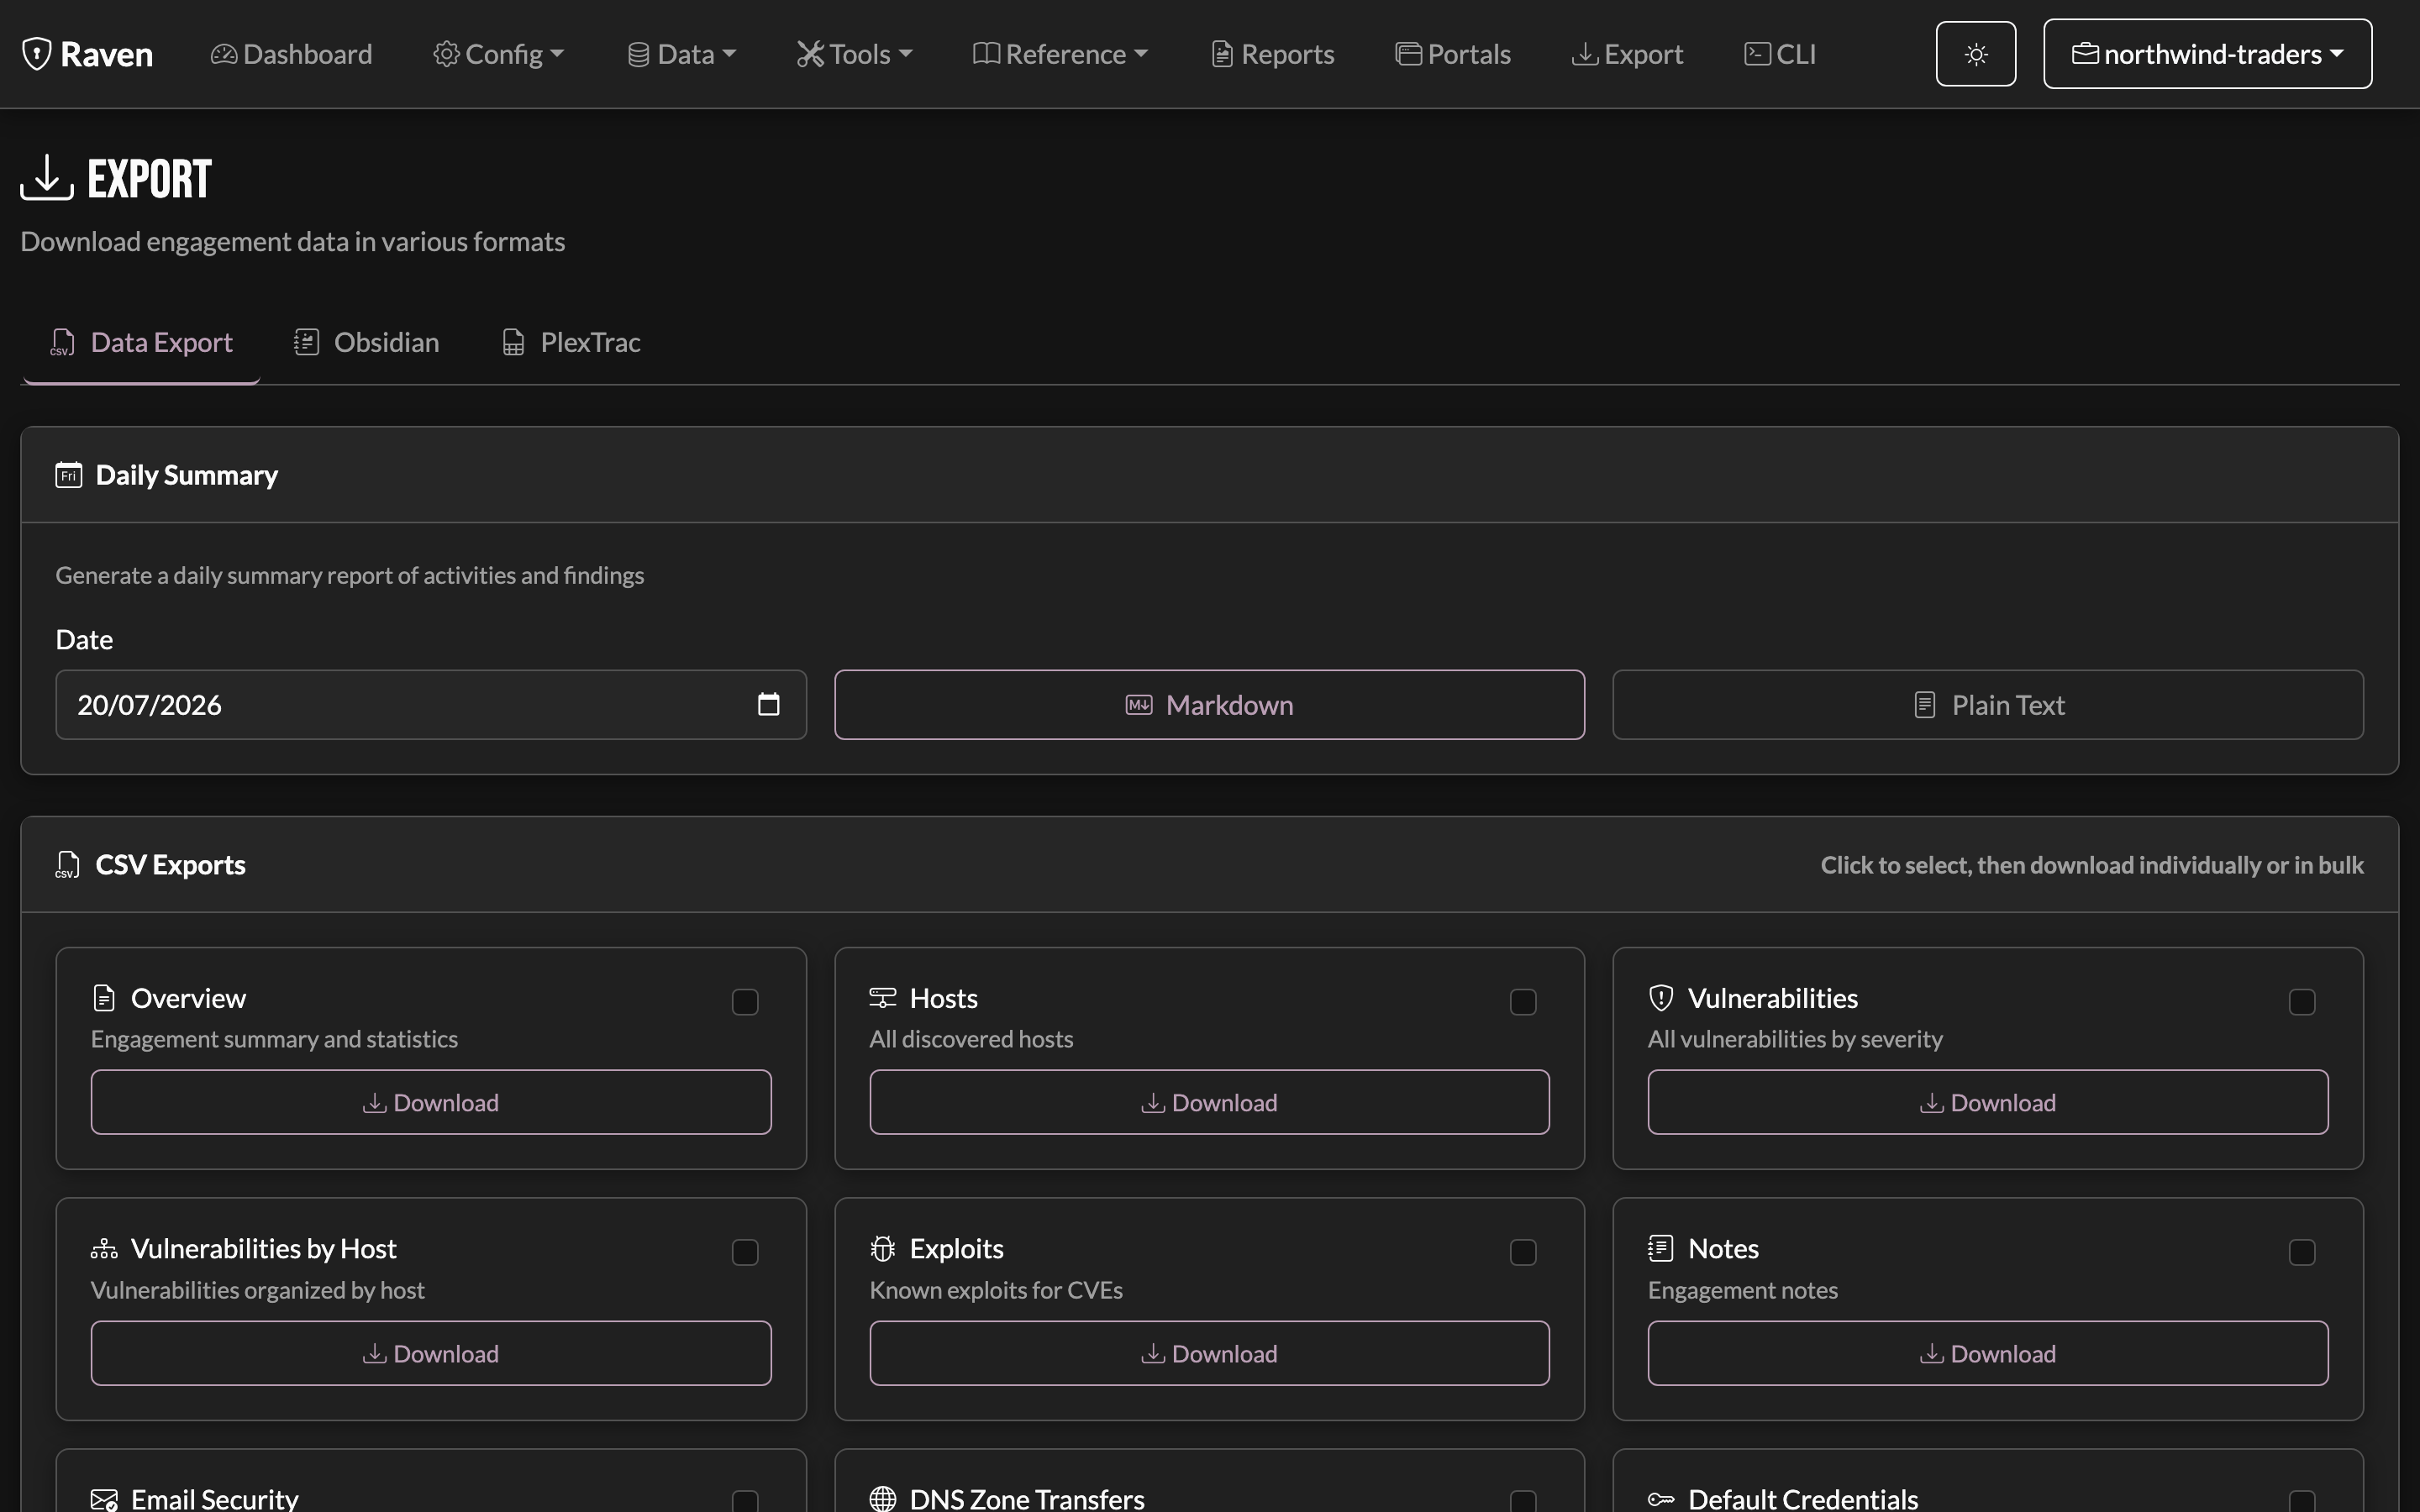
Export findings and hosts, or push to another tool:
Export Formats
- CSV - Spreadsheet-ready findings
- JSON - API and automation friendly
- Markdown - Documentation ready
- PDF/DOCX - Client deliverables
Integrations
- Burp Suite - Import scan results
- Nessus - Import vulnerability scans
- PlexTrac - Direct export to platform
Jobs & Background Tasks
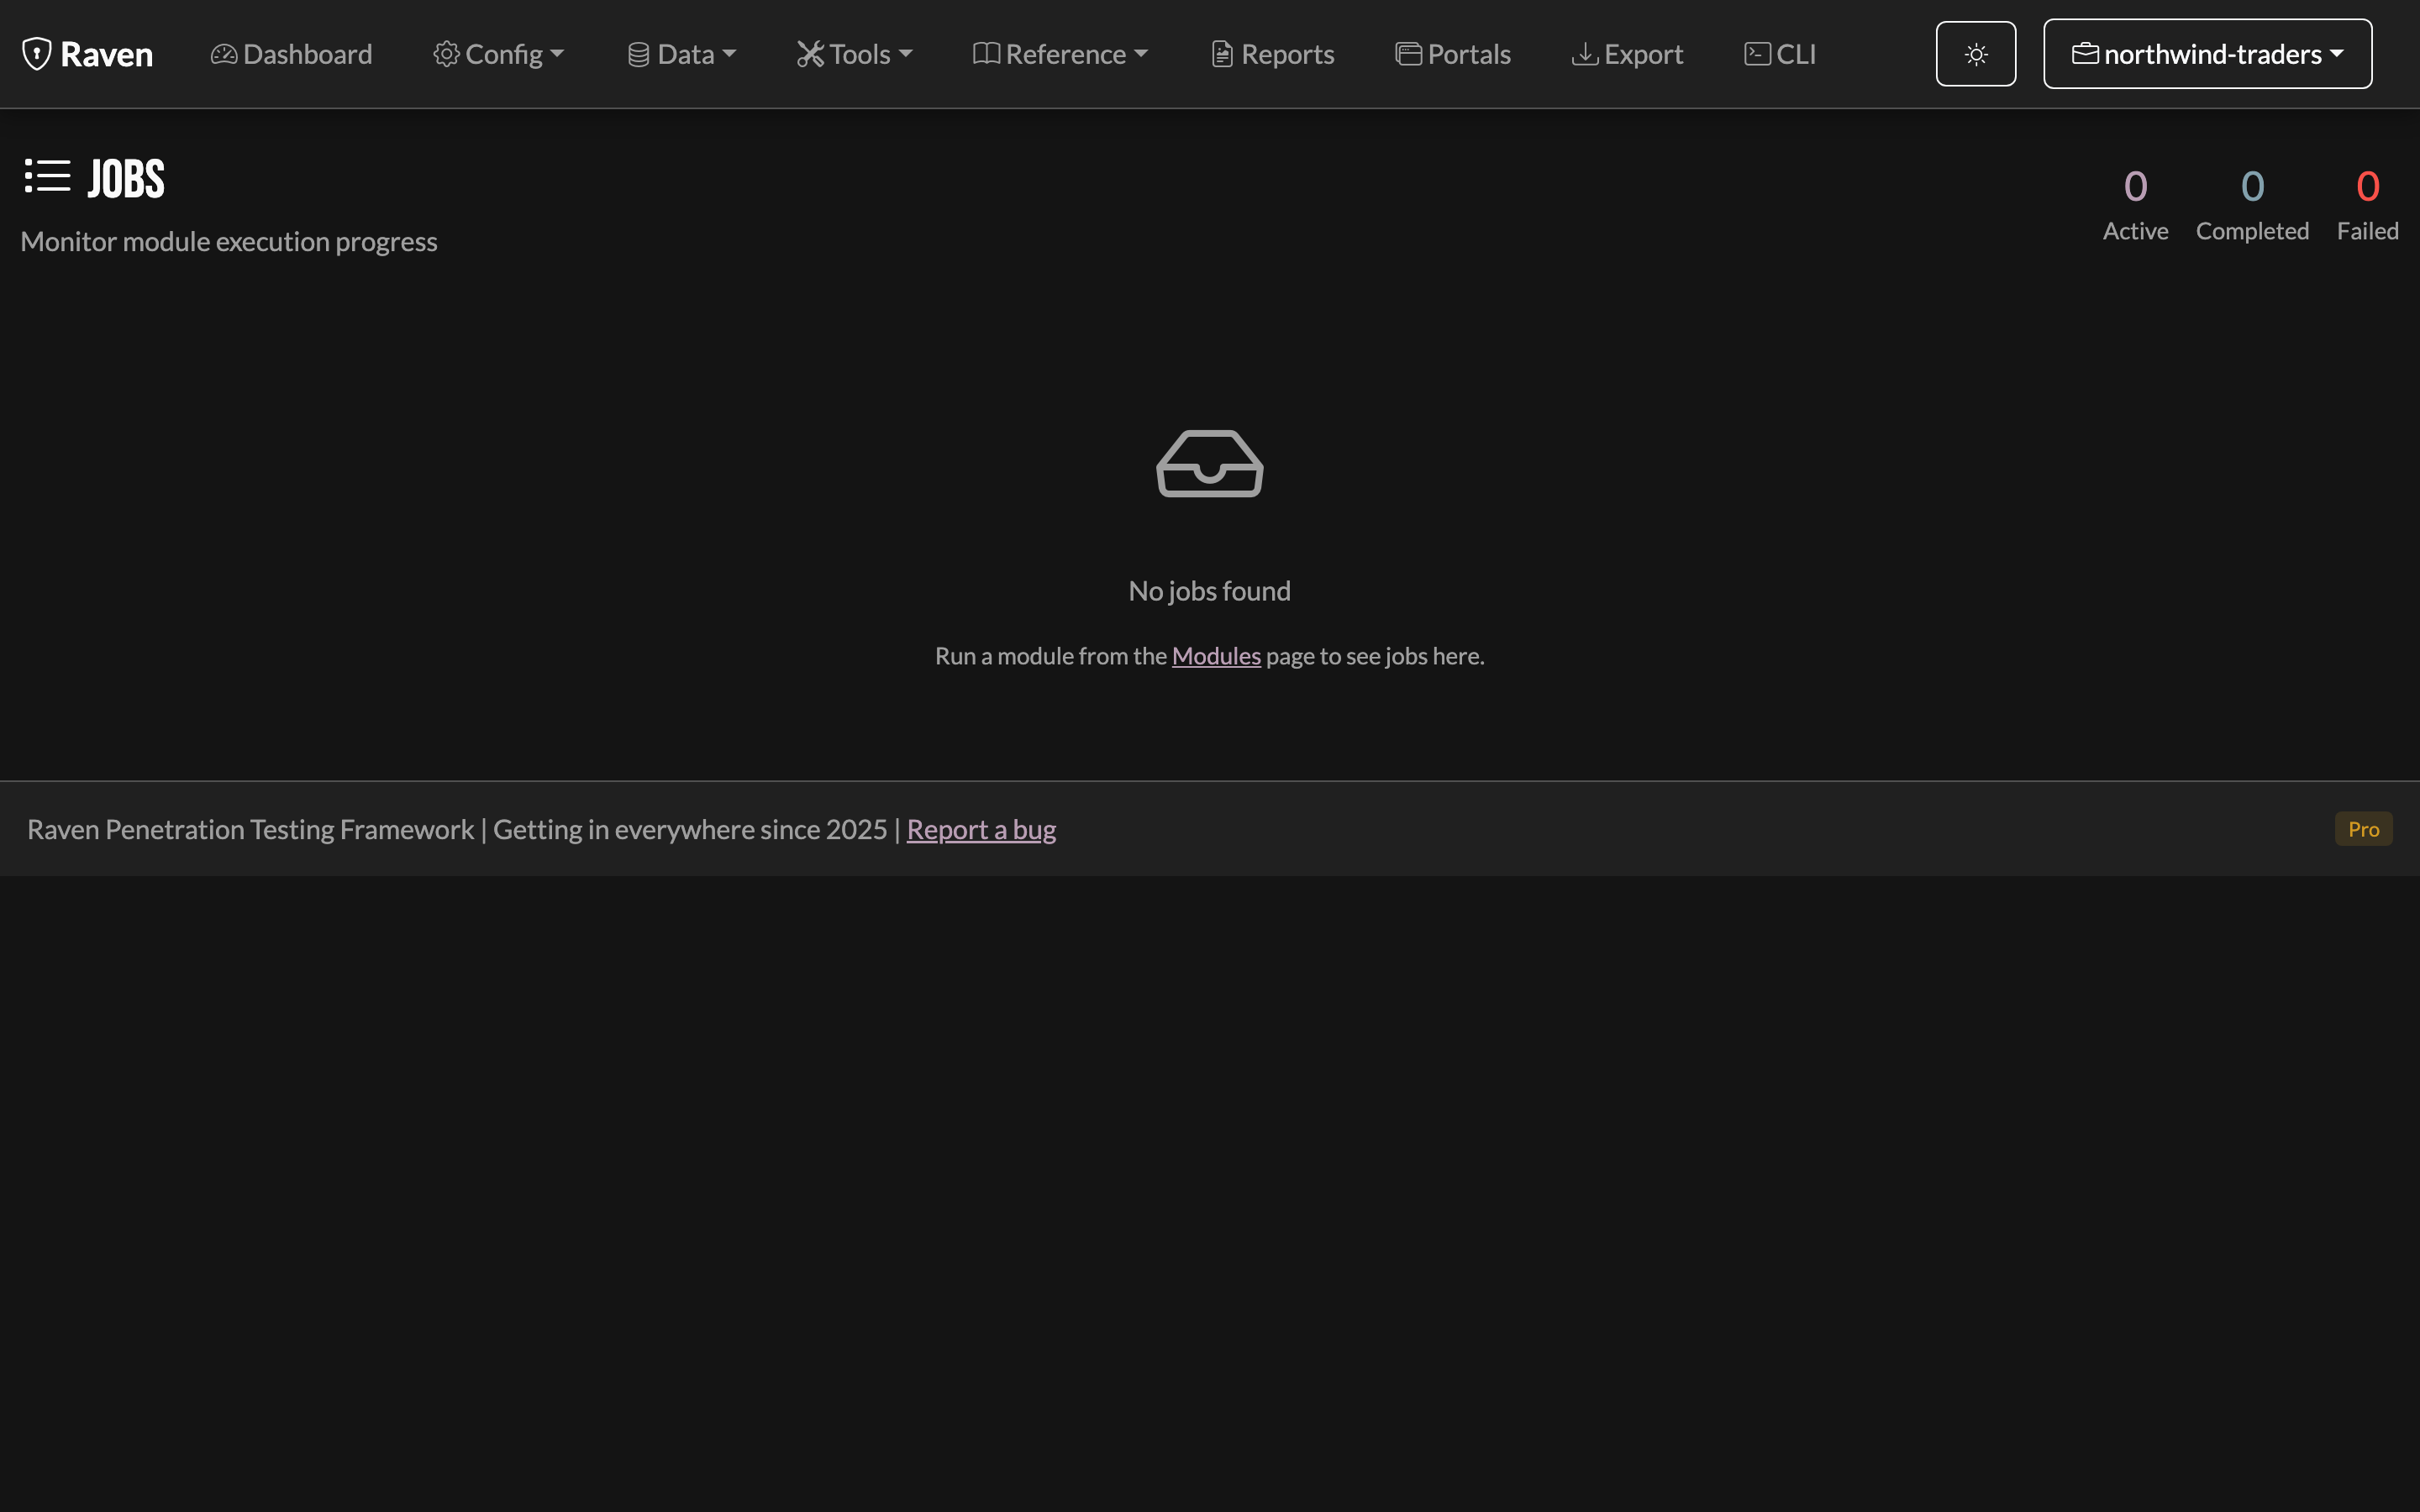
Monitor long-running operations:
- Active jobs - Currently running scans
- Job queue - Pending tasks
- History - Completed operations
- Logs - Detailed output for troubleshooting
Job Controls
- Cancel - Stop running jobs
- Retry - Re-run failed tasks
- View output - See detailed results
Remote Agent (RTA)
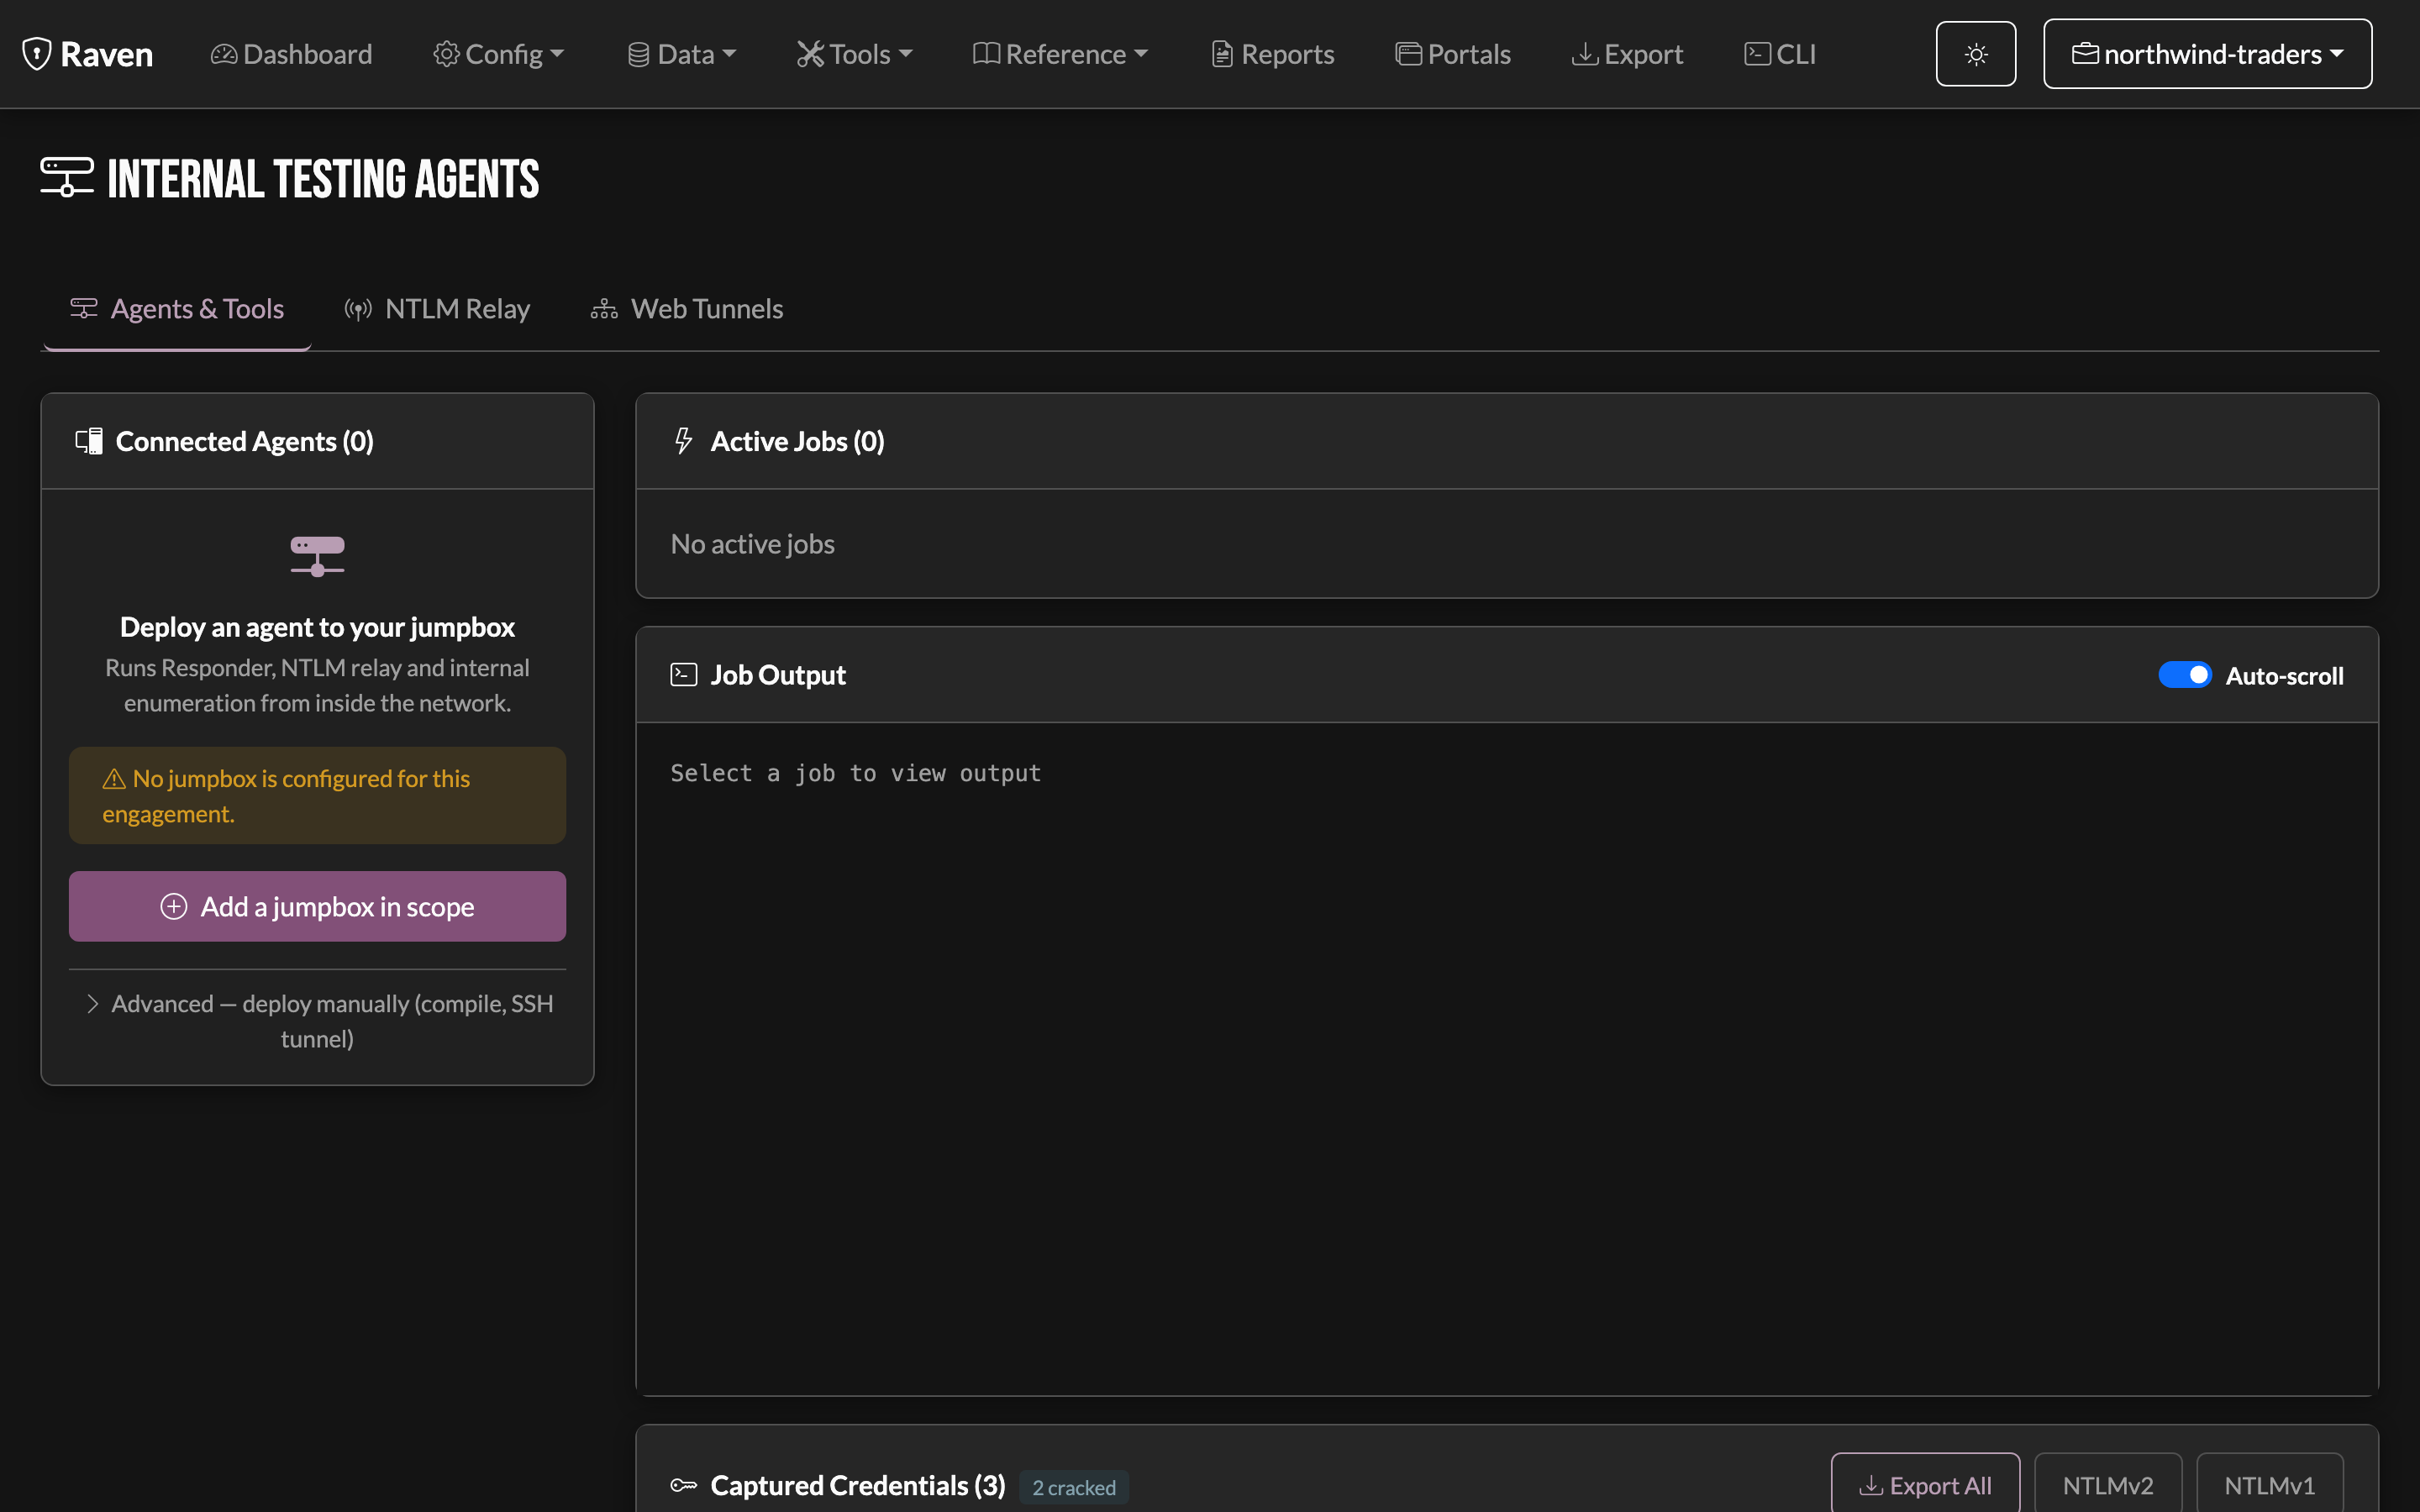
Deploy a Go-based agent to jumpboxes for remote scan execution:
- Agent Deployment - Cross-compile and upload to jumpbox automatically
- Real-time Streaming - Job output via WebSocket
- Credential Capture - Auto-parse hashes from tool output
- Tool Detection - Agent discovers available tools (responder, impacket, etc.)
- Job Management - Start, stop, and monitor remote jobs
See the Remote Agent (RTA / Jumpbox) guide for deployment and setup.
Notes & Documentation
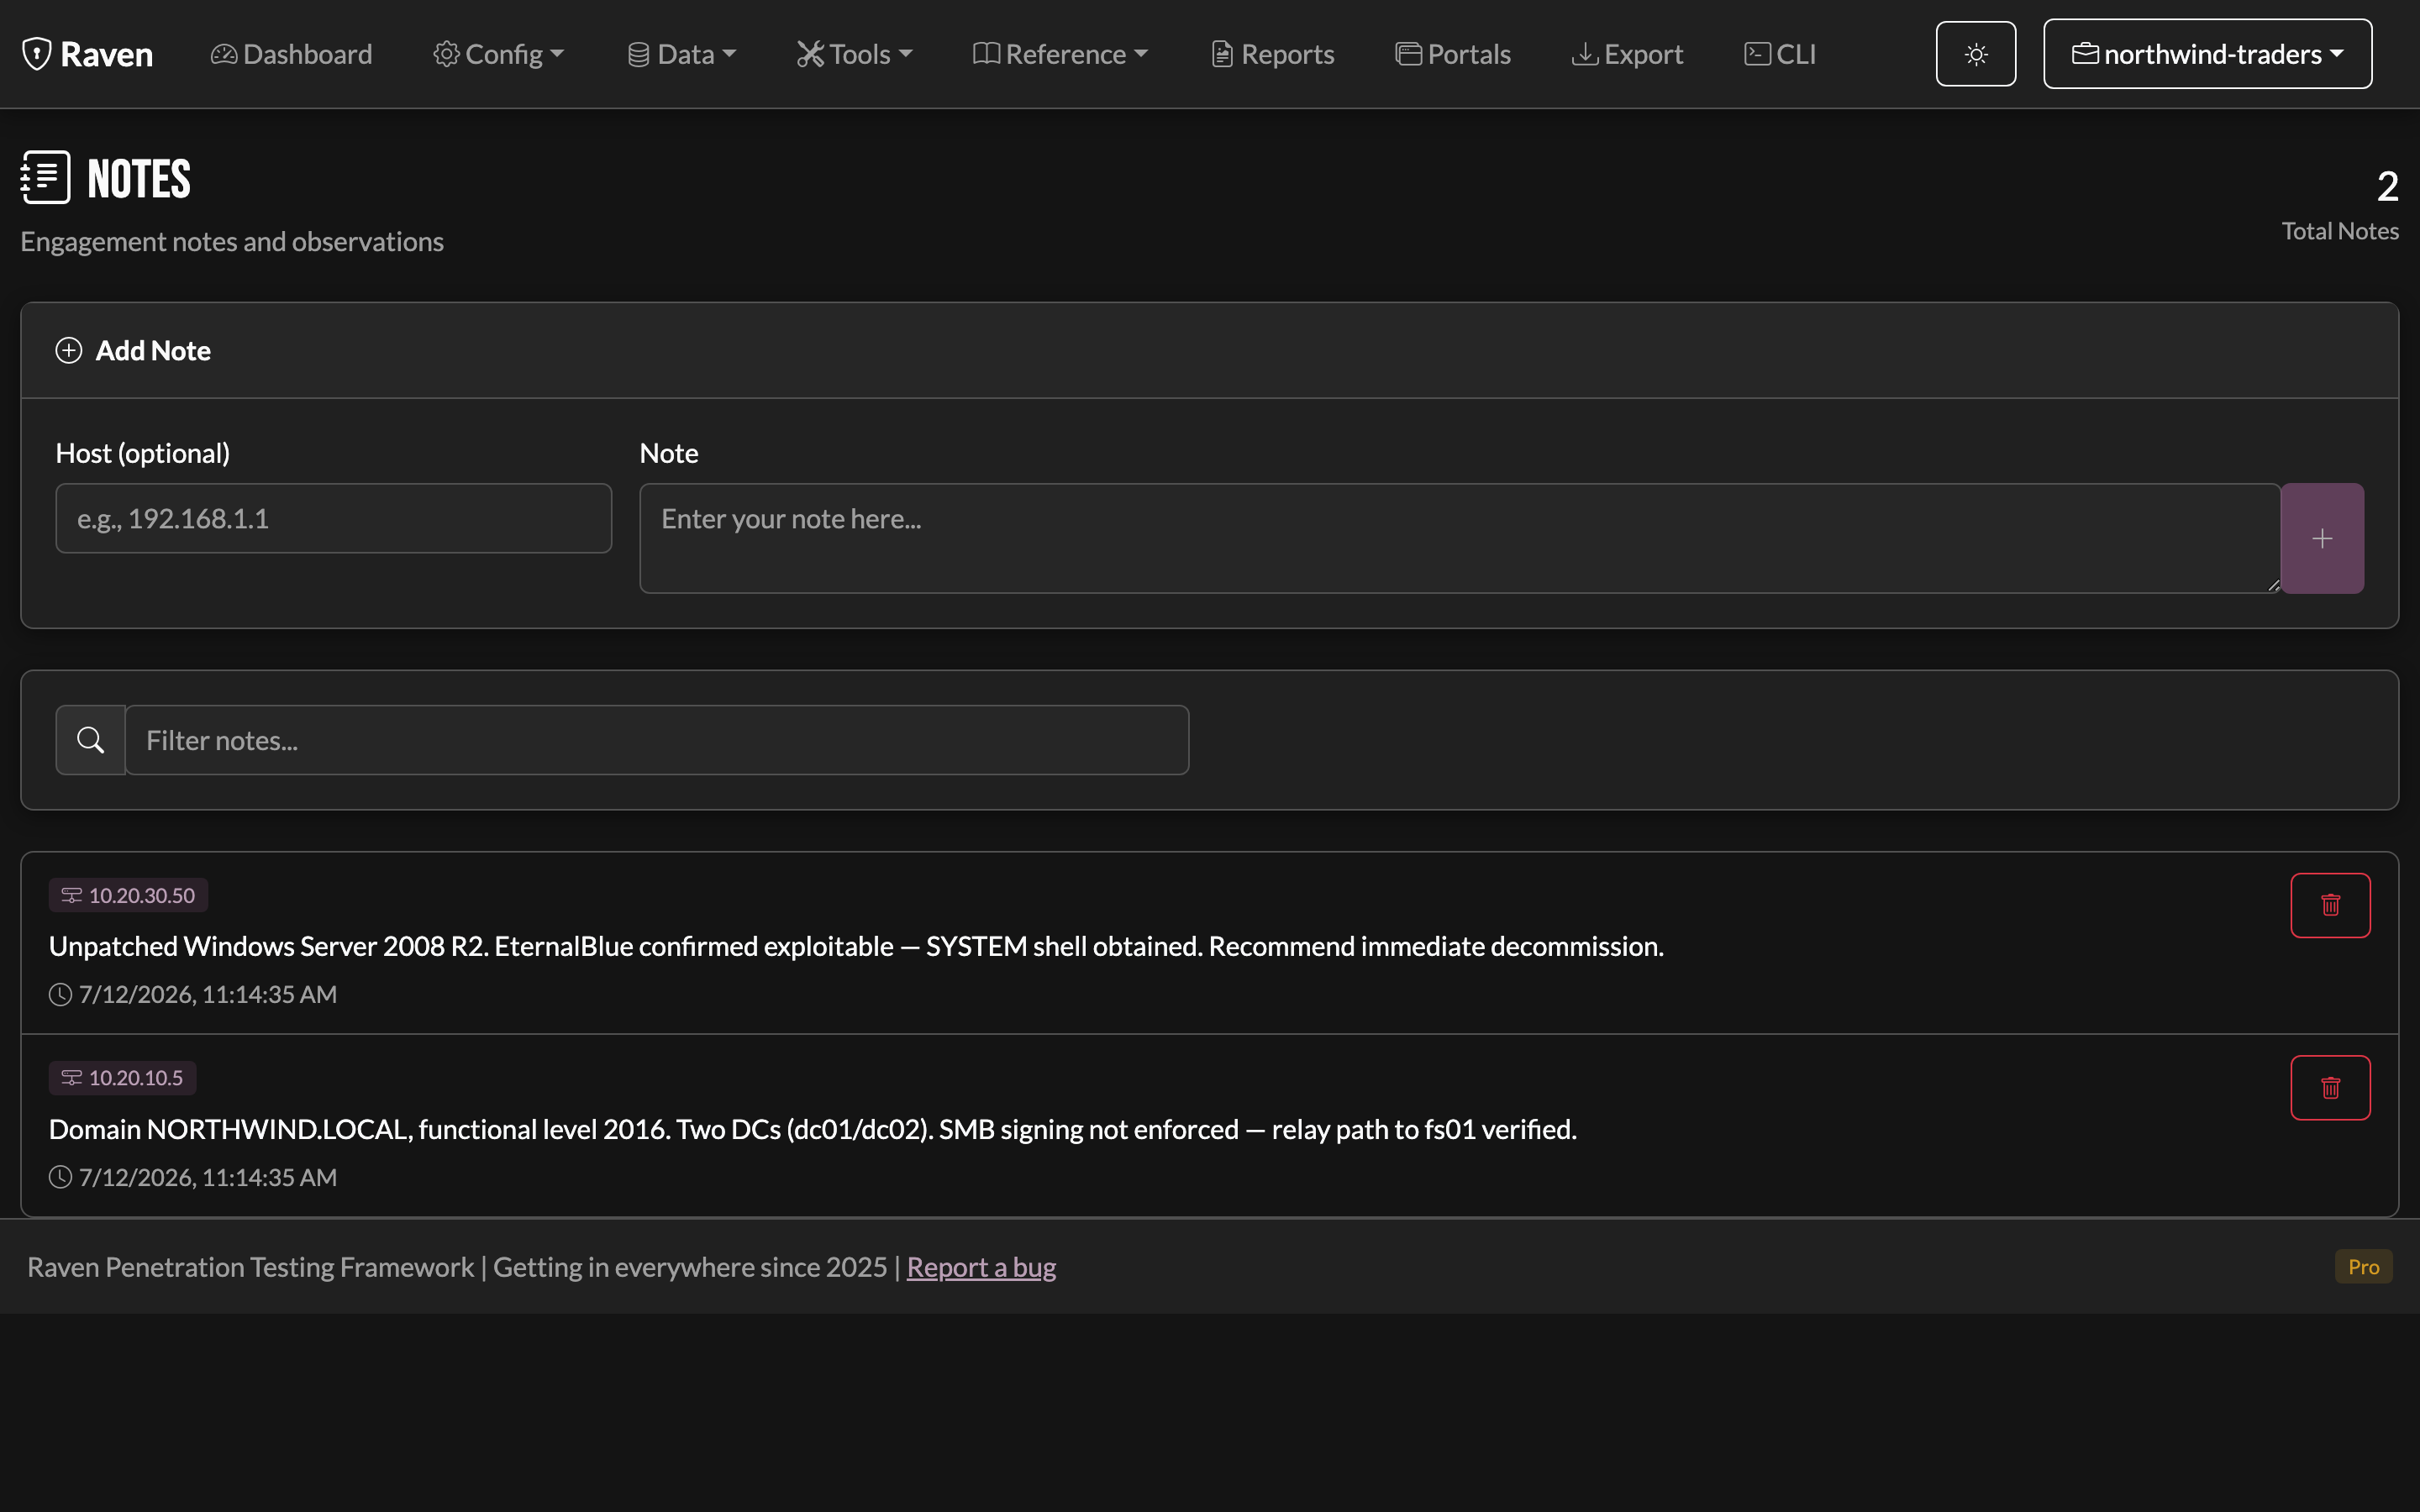
Capture observations and methodology:
- Free-form notes - Markdown supported
- Target linking - Associate with specific hosts
- Categories - Organize by type
- Search - Find notes quickly
- Export - Include in reports
Methodology
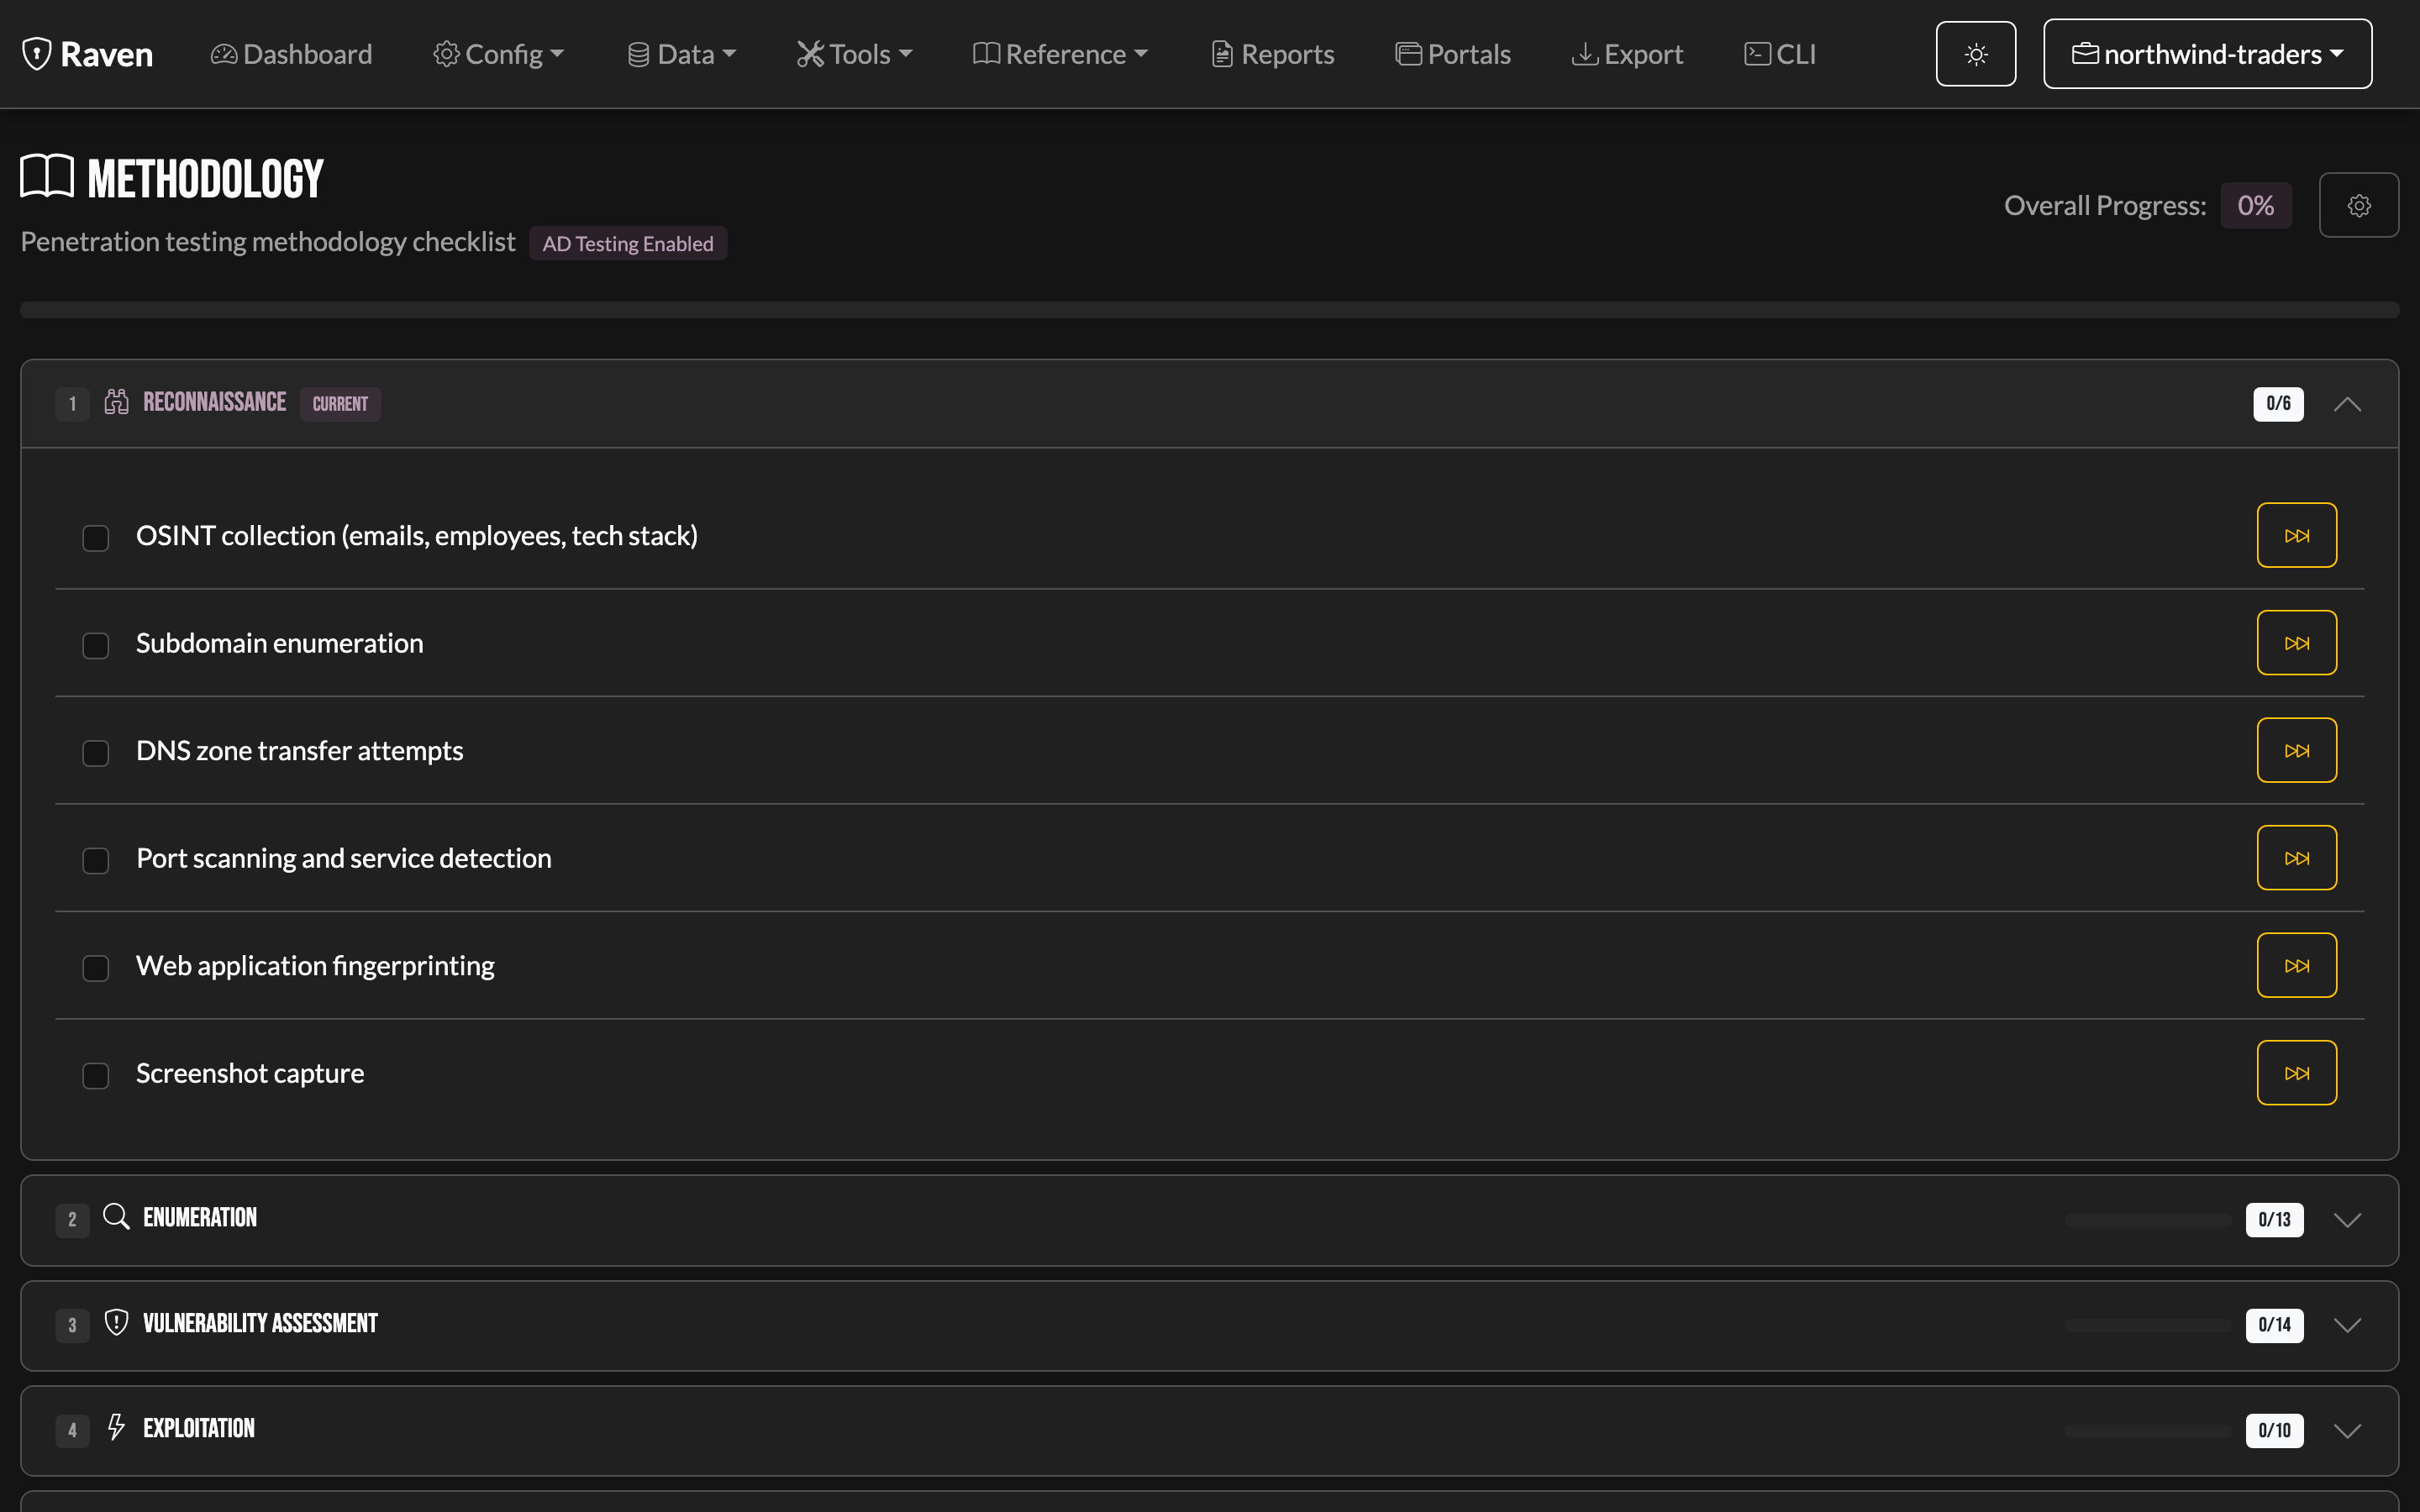
The Methodology checklist tracks coverage across the phases of an engagement (Reconnaissance, Enumeration, Vulnerability Assessment, Exploitation, and so on) with per-phase progress. It adapts to the engagement type (the example above has AD testing enabled). Use it to make sure nothing's been skipped before you write up.
Active Directory
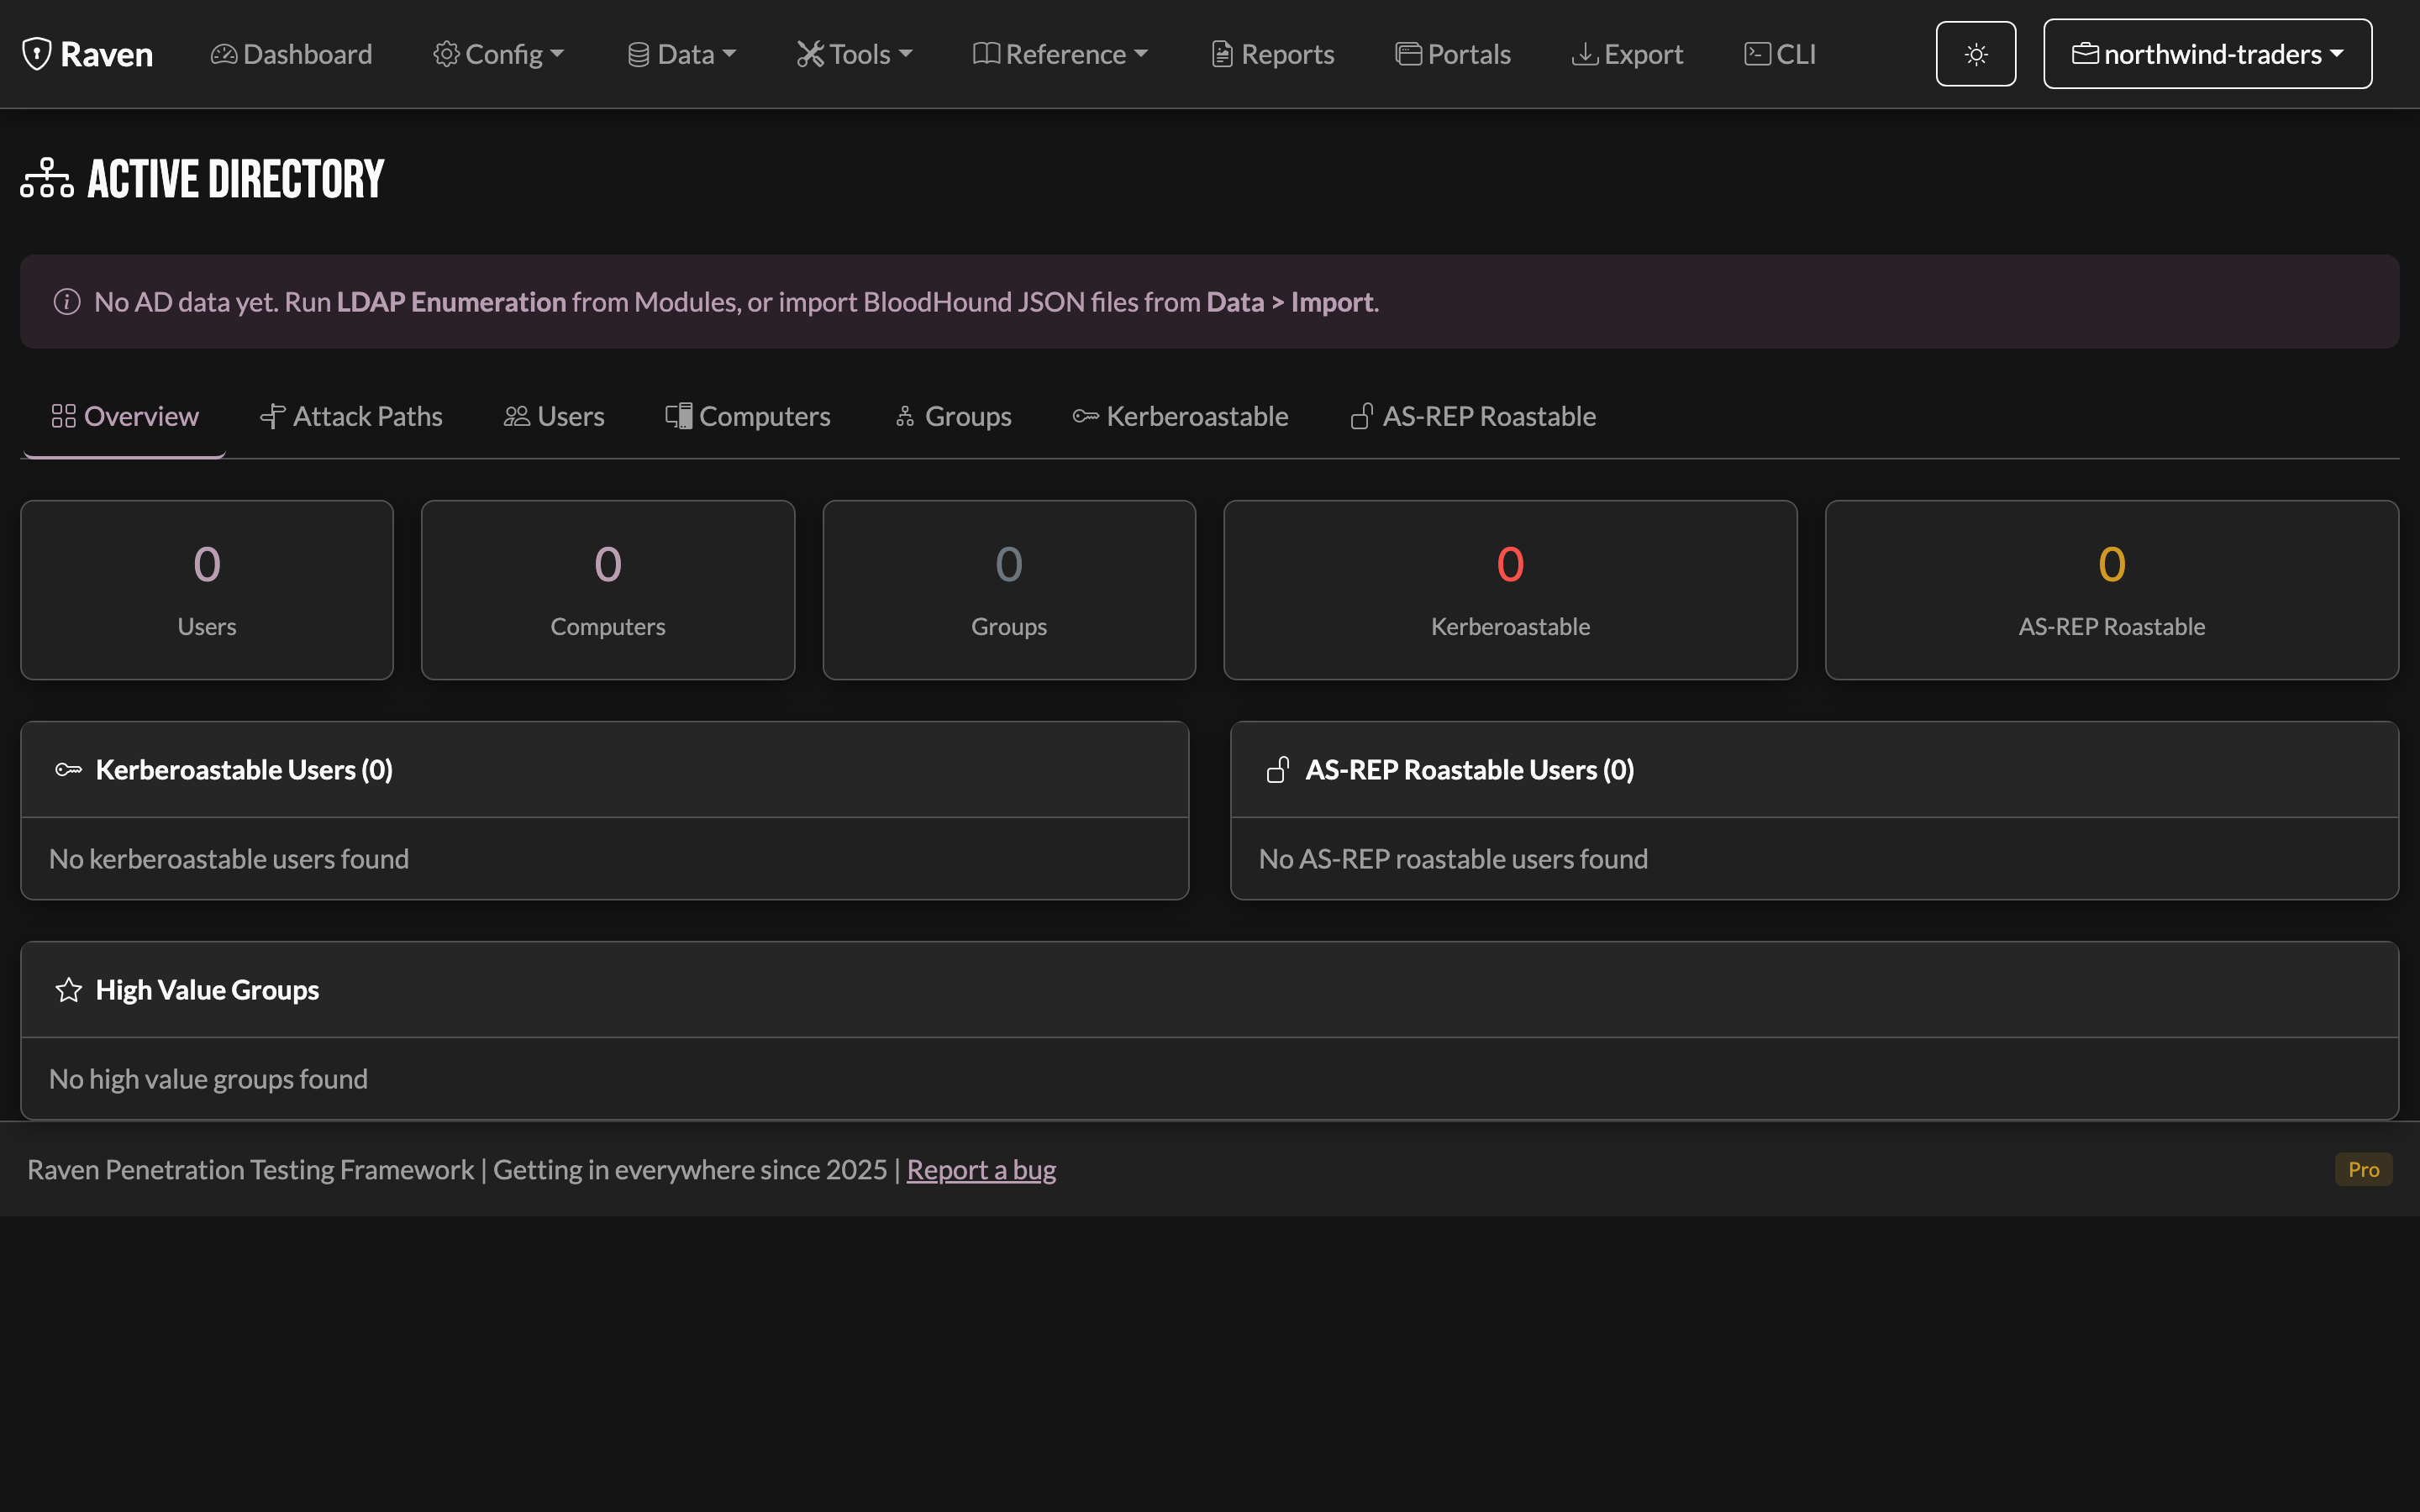
For internal engagements, import a BloodHound collection (Import page) and Raven surfaces the AD picture: users, computers, and groups, with Kerberoastable and AS-REP-roastable accounts and high-value targets called out. Attack-path context feeds the advisor and your write-ups.
Credentials Library
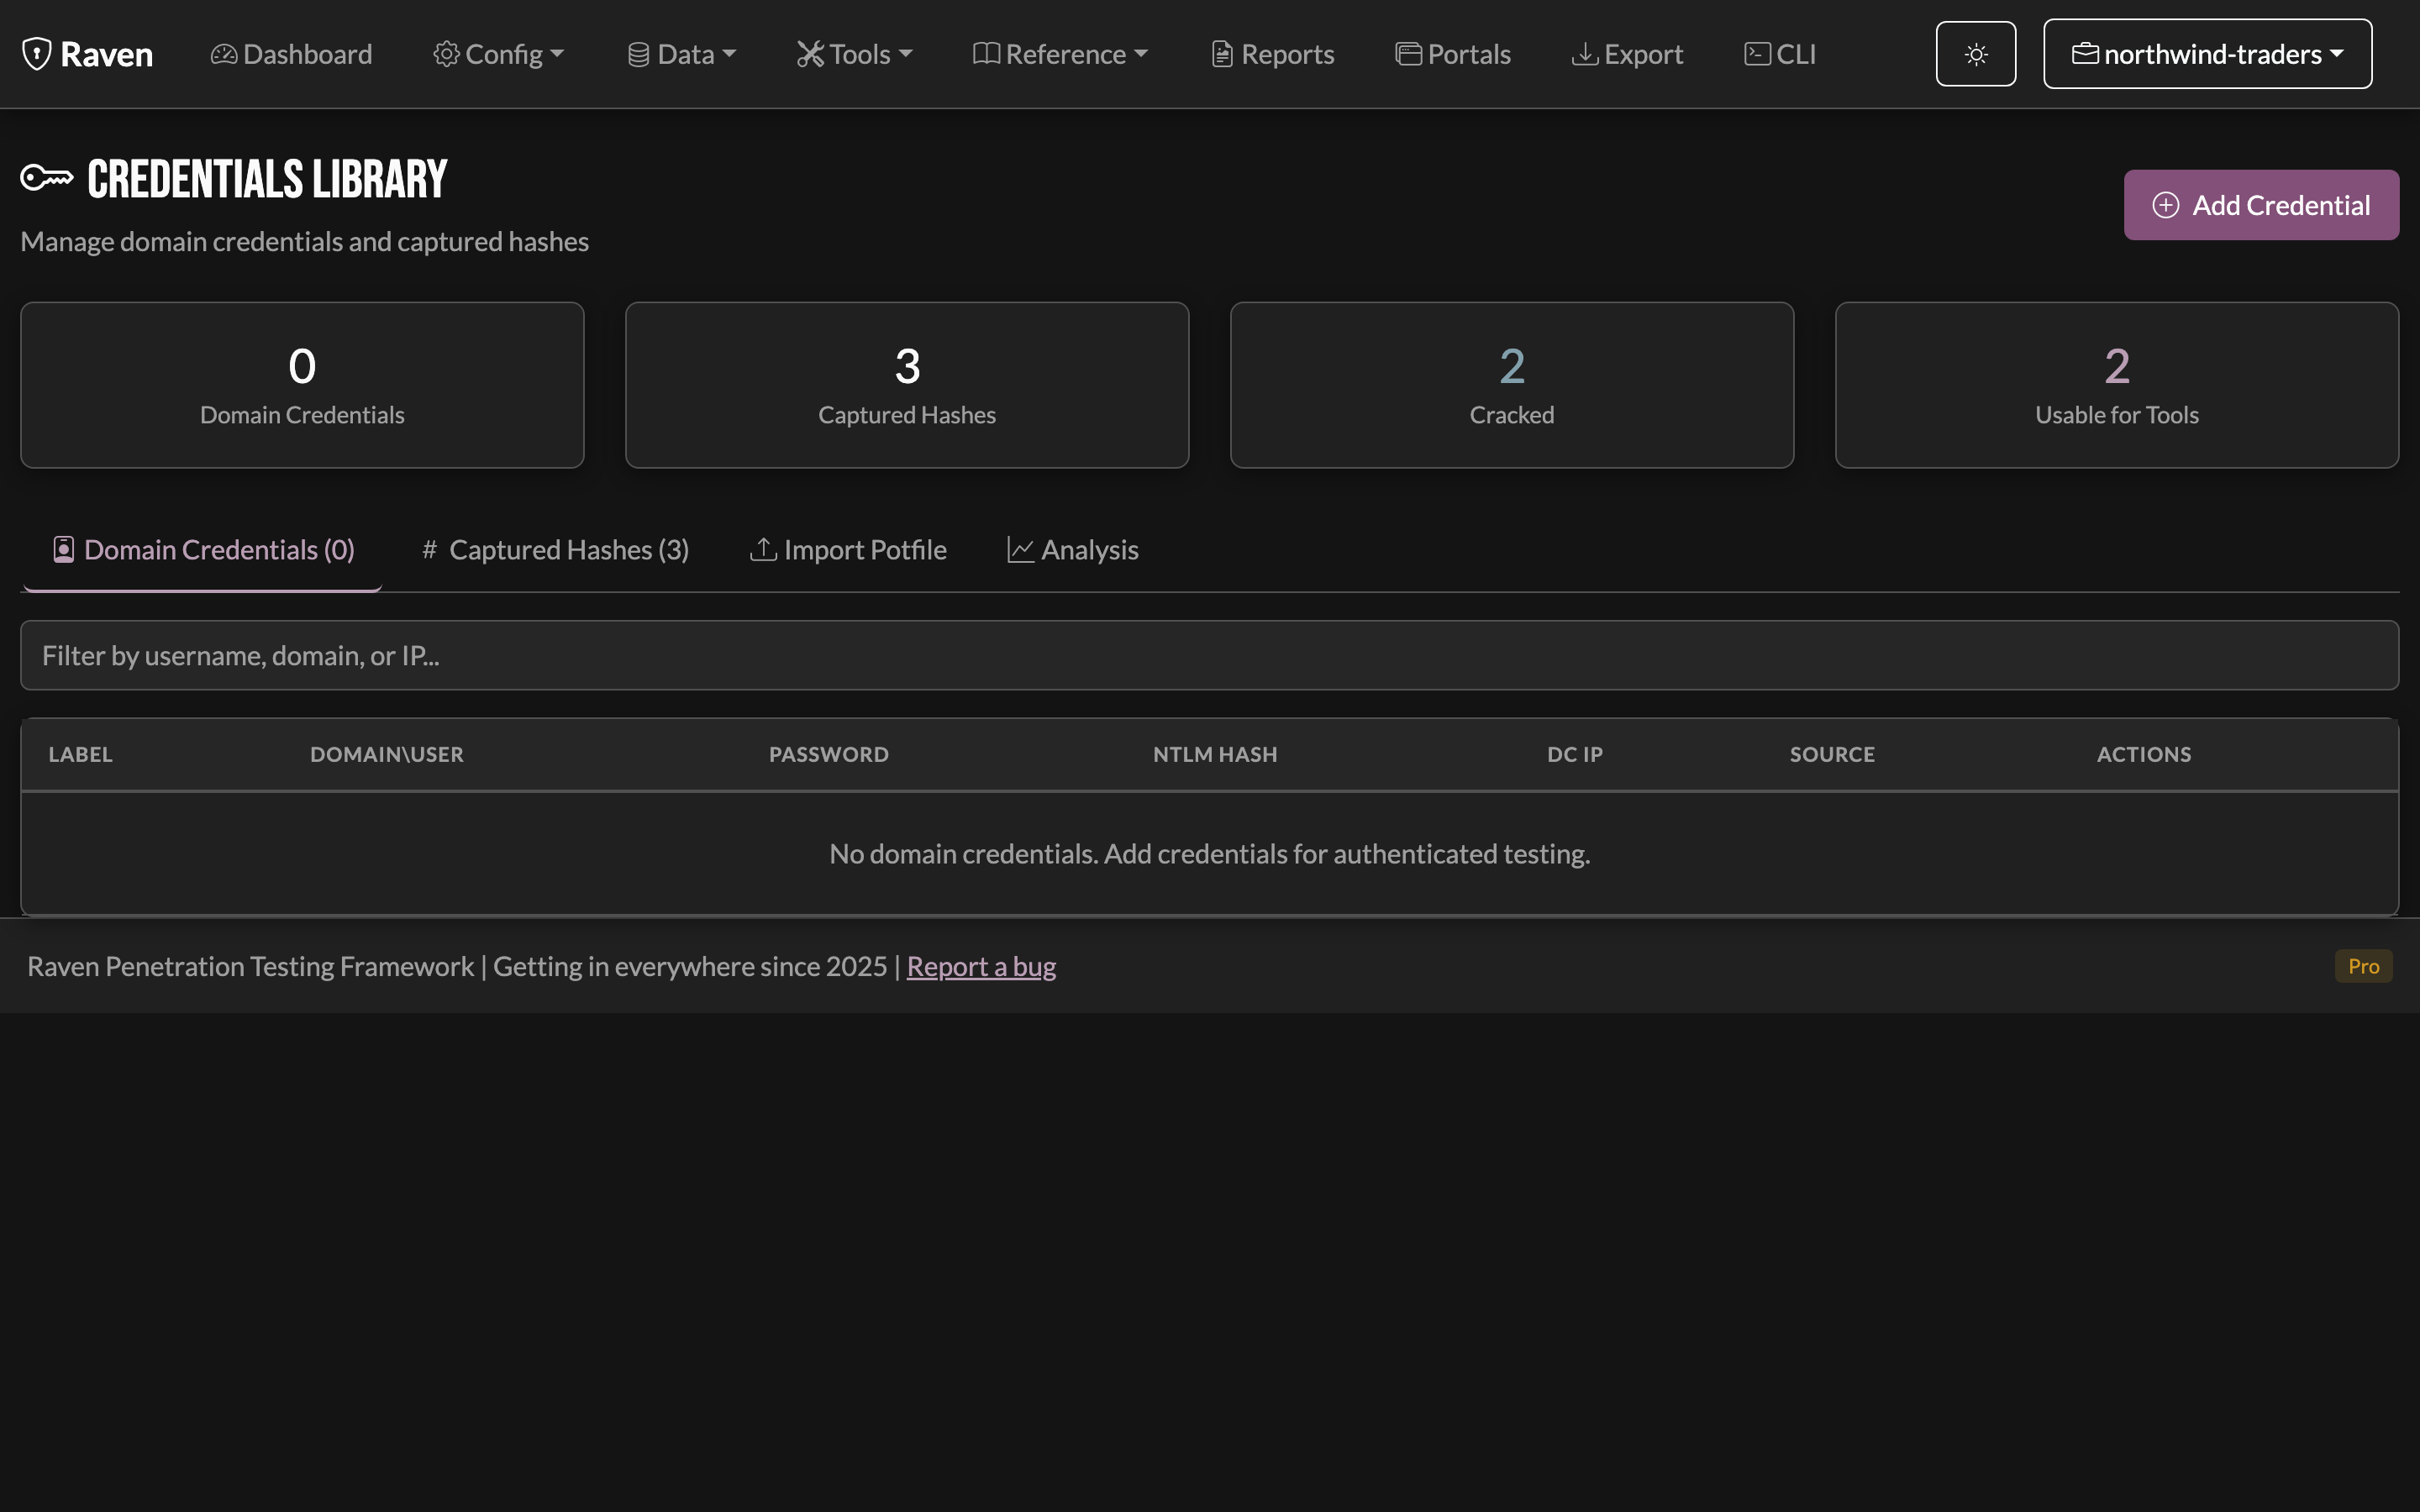
The Credentials Library collects domain credentials and captured hashes in one place: what's been captured, what's been cracked, and what's usable for authenticated tooling. Captured hashes and configured credentials are tracked separately.
Local only
Credentials never leave your machine. Real passwords and hashes are never sent to the AI proxy; only anonymized statistical signal is. See AI Analysis.
Configuration
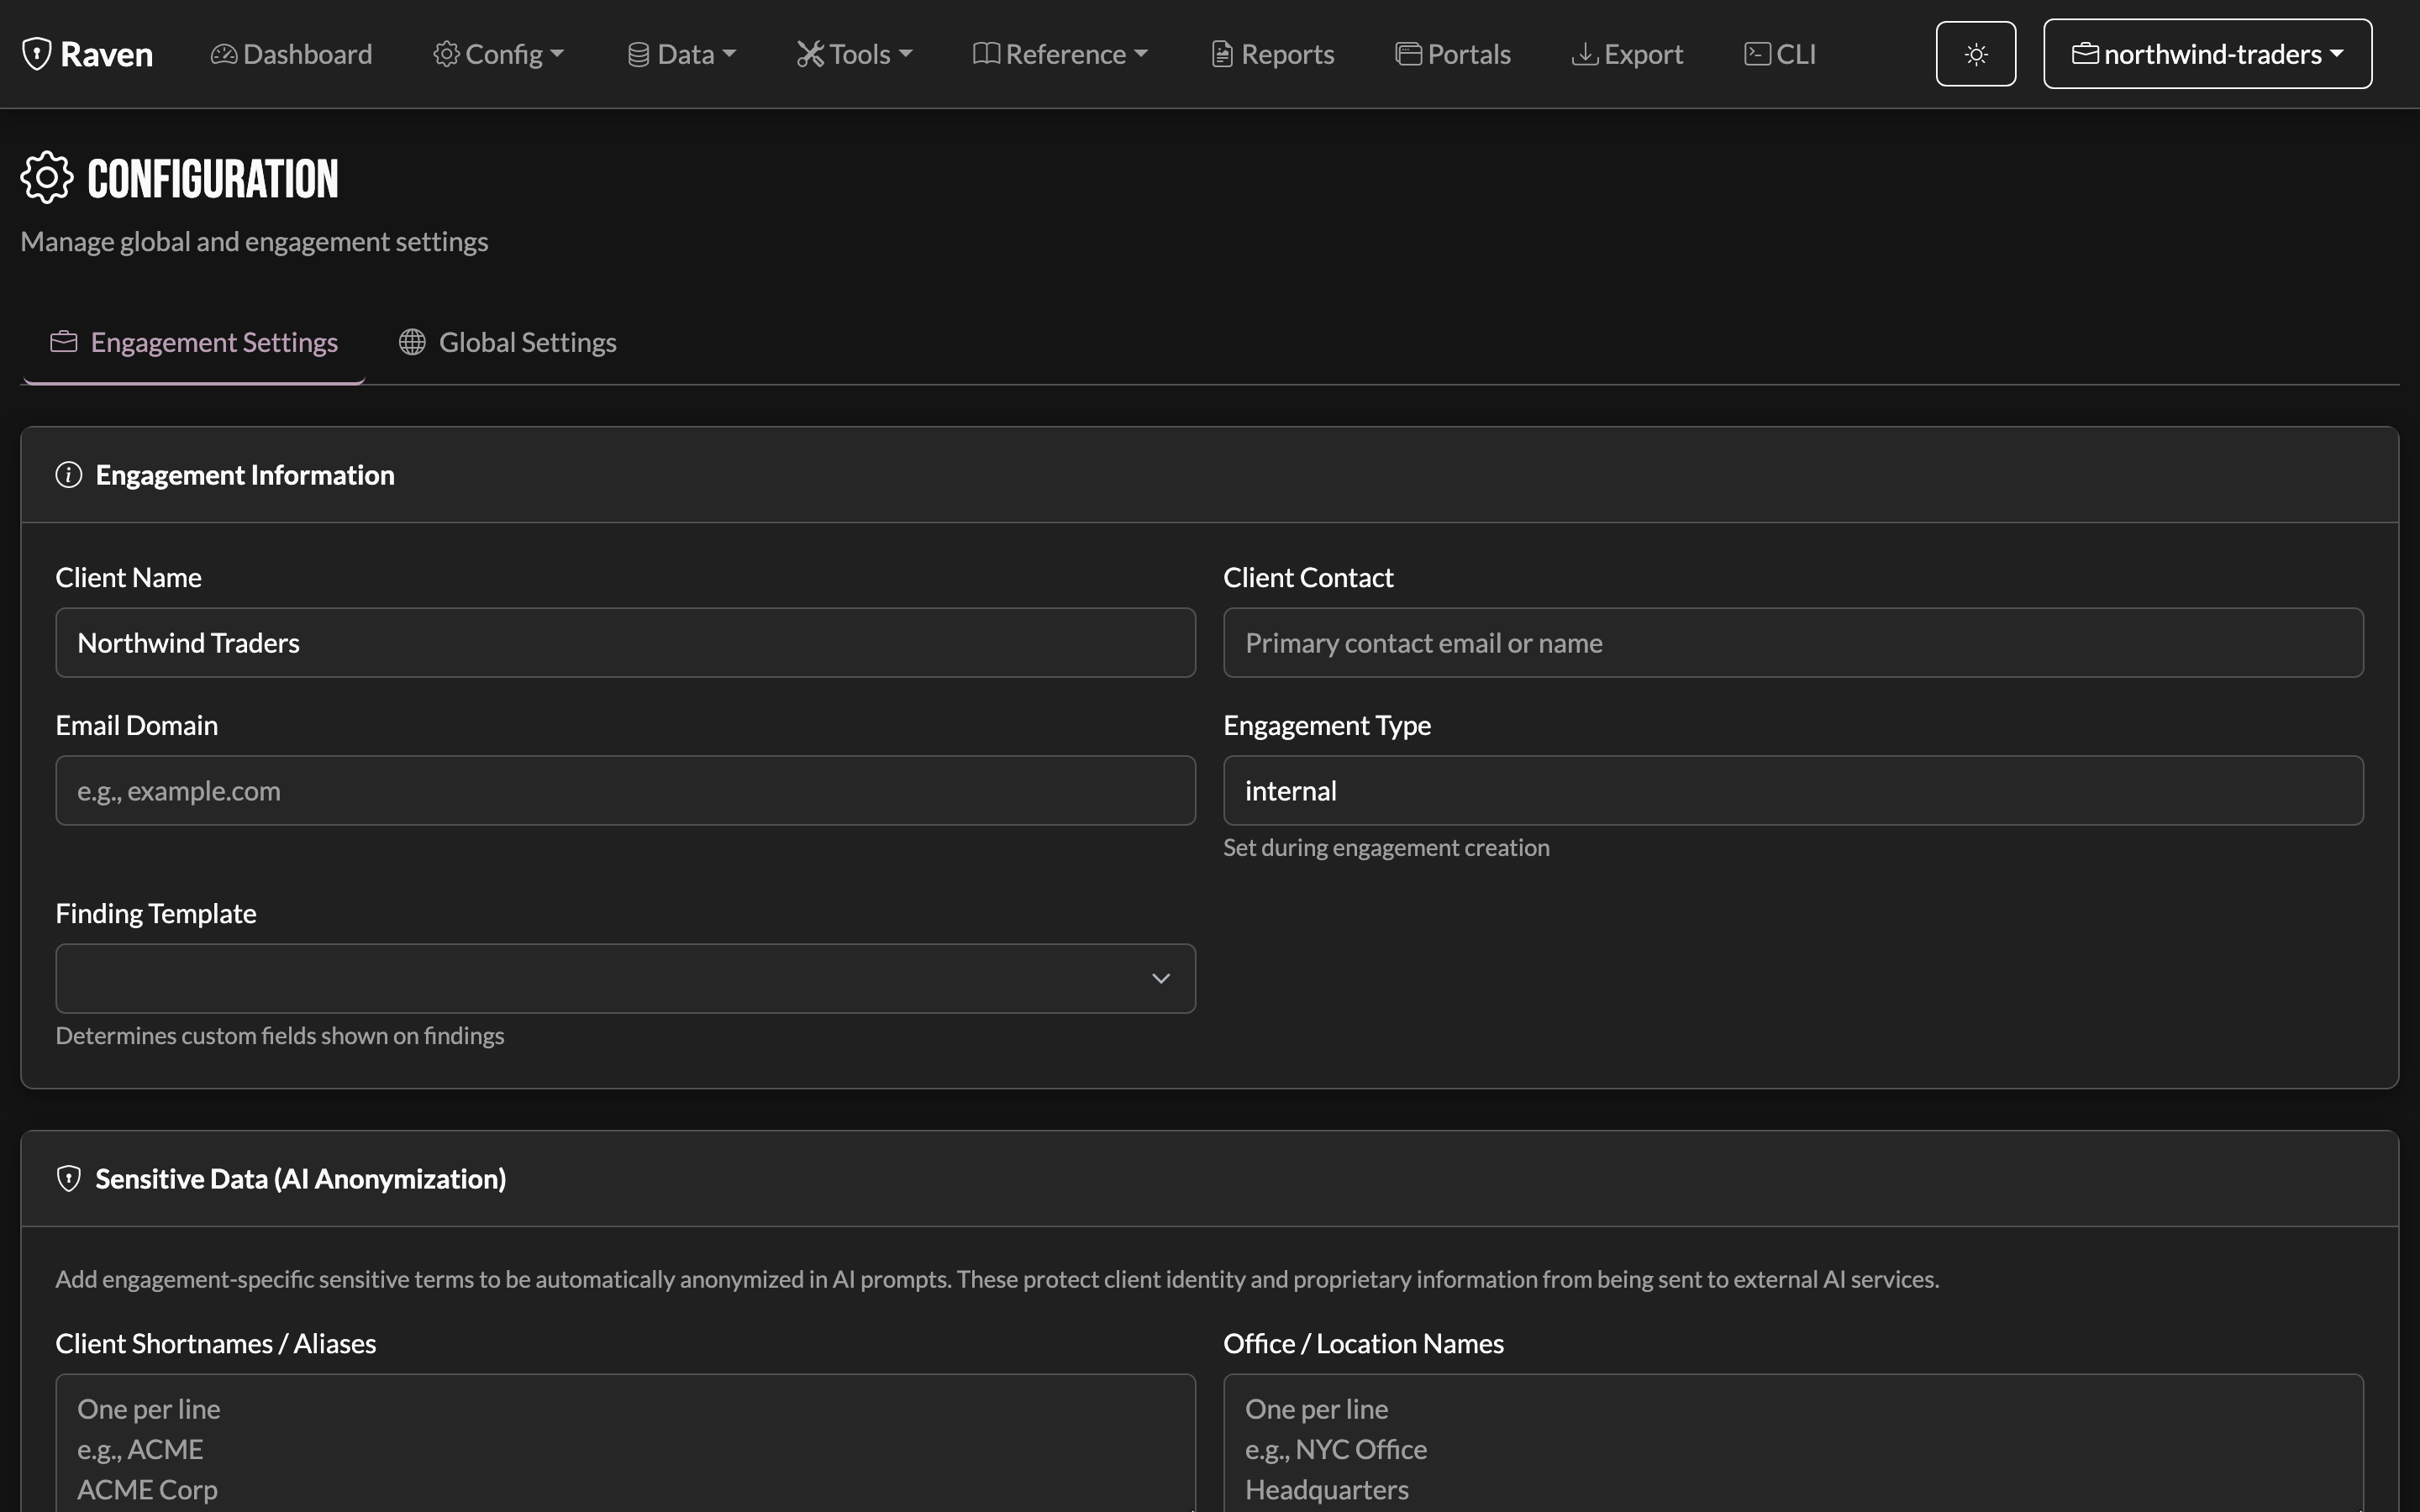
Configuration holds engagement settings (client name, type, finding template) and global settings. The Sensitive Data block is where you register client shortnames, office names, and other terms that should always be anonymized before any AI request. They're replaced with placeholders alongside the automatic host/domain/email/username anonymization.
Layout
Engagement settings are split into tabs: Engagement, Privacy and AI, API Keys, Testing Windows, Infrastructure and Cracking.
There is one Save for the whole page, pinned to the bottom of the window so it stays reachable from every tab. Saving writes every tab, not just the one you are looking at, so you can change several and save once.
API key precedence
Keys can be set globally and overridden per engagement:
| Engagement value | What is used |
|---|---|
| Set | The engagement value |
| Blank | The global value |
| Cleared | The global value |
So leaving an engagement key blank is not "no key", it means "use the global one". To stop a key being used at all, clear it in Global Settings too.
Changes take effect on the next tool run. If a tool reports a missing key after you have entered one, check the value actually saved: the Save button applies to the whole page and must be pressed before anything is written to disk.
Reference
Raven bundles offline reference material you can reach without leaving an engagement:
-
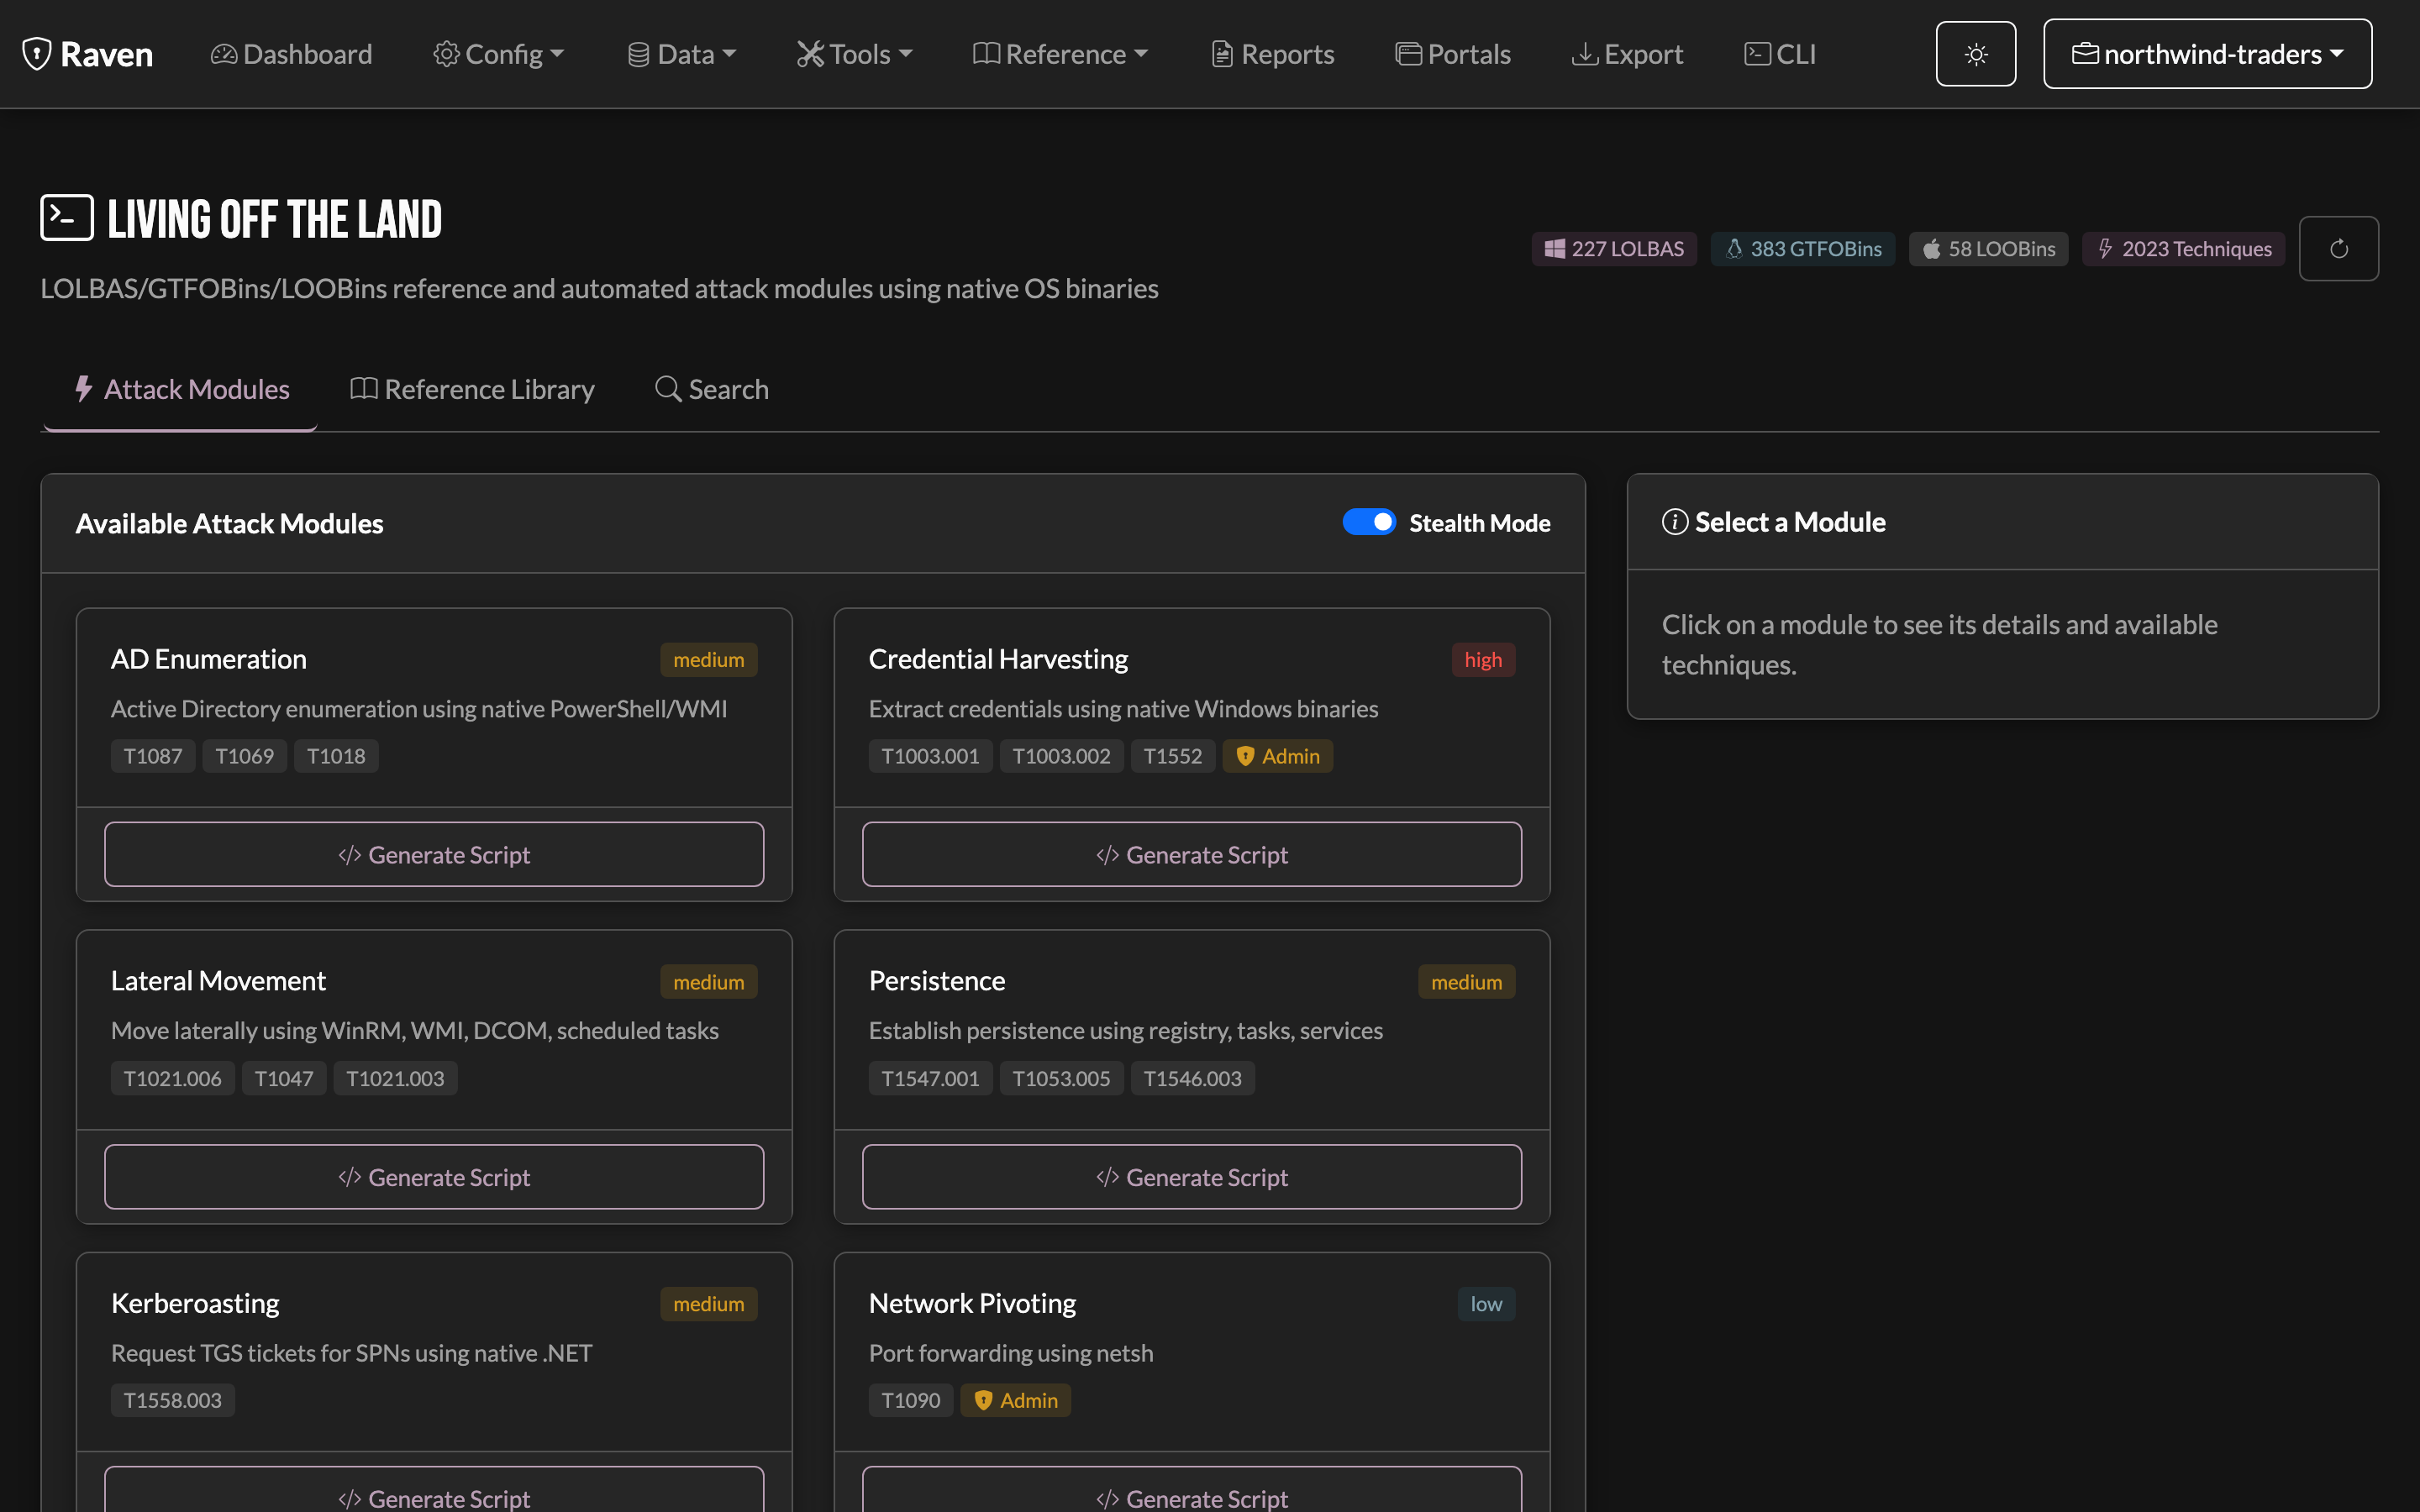
Living Off The Land: LOLBAS / GTFOBins / LOOBins lookups plus native-binary attack modules with copy-ready commands.
-
Offensive Tools: a categorized reference of common offensive tooling and usage.
- Cheatsheets: quick-reference command cheatsheets.
- Findings Library: reusable finding templates to drop into an engagement.
Tips & Best Practices
Efficient Workflow
- Import scans first - Nessus, Nuclei, etc.
- Use AI consolidation - Reduce duplicates
- Triage by severity - Critical/High first
- Add evidence - Screenshots, proof
- Generate report - Use templates
Organization
- Tag findings - By technique, service, priority
- Link related items - Build attack chains
- Take notes - Document methodology
Performance
- Use filters - Don't load everything
- Archive old engagements - Keep things fast
- Export regularly - Backup your work